Millennials might be one of the most powerful age groups; however, a new generation is stepping onto the stage. Gen Z comes with many preferences that differentiate this age group from everyone else, millennials included. People born between 1997 and 2012 belong to a group destined to leave a long-lasting impact on the planet. Gen Z statistics show that this group comprises young and open-minded individuals, creative, independent, and most of all, fully digital.
Here are some stats we have compiled for you to let you in on the secrets surrounding this generation and their behavior, habits, and perceptions.
Gen Z Statistics (Editor’s Choice)
- Generation Z comprises 27% of the total US population. (Insider Intelligence)
- Over one-third of Generation Z are not religious. (Survey Center on American Life)
- Only 45% of Gen Zers report they have very good mental health. (AECF)
- 87% of Gen Zers in the US said they are worried about the environment. (AECF)
- 65% of Gen Z consumers have increased their use of social media in the last few years. (SproutSocial)
- 70% of high schoolers want to follow their own path in education. (Lead Squared)
- 74% of teenagers spend their free time online. (Thrive My Way)
- Gen Z accounts for $43-$44 billion of direct spending. (Trifecta)
General Statistics About Gen Z
1. Generation Z comprises 27% of the total US population.
The Generation Z year range spans from those born after 1996 up to those born in 2012. It’s following Millennials as the largest emerging group of consumers; however, more tech-addicted and social justice fanatics. It’s the youngest, and most ethnically diverse generation in the US, that grows with technology and the internet, using it all the time in their daily lives.
(Insider Intelligence)
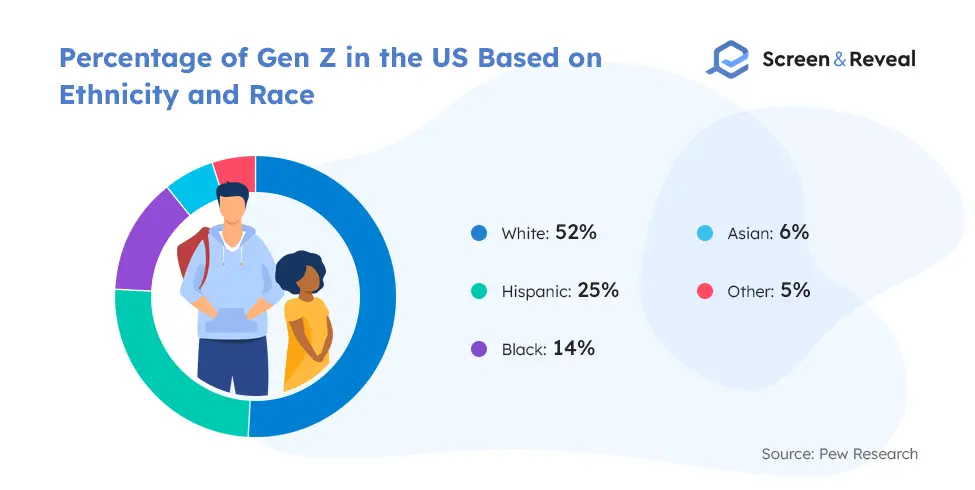
2. 52% of Gen Z in the US are non-Hispanic white.
This is a bare minimum difference from other ethnicities, considering the previous generations. Generation Z statistics suggest that they are the most racially and ethnically diverse bunch. One in four Gen Z individuals in the US are Hispanic, 14% are Black, while 6% are Asian. Other races comprise 5% of this age group.
(Pew Research)
3. 51% of Gen Z think they are more creative than their predecessors.
Those are one of the most creative generations. Some 77% of individuals from this age group like doing creative activities, like painting. 48% claim they regularly do this kind of activity, for instance, meme creation, while online.
(HubSpot)
Generation Z Religion Statistics
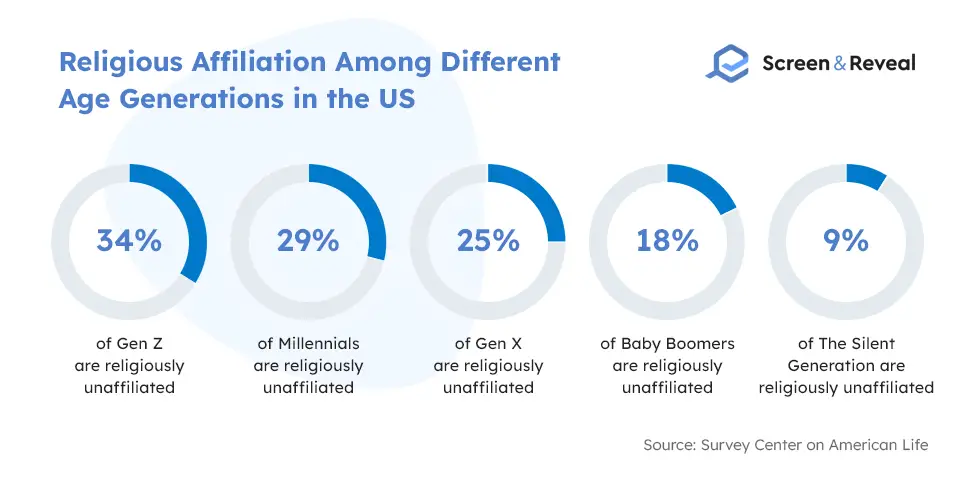
4. Over one-third of Generation Z is not religious.
According to the latest research on religion in America, each generation seems to be less religious than the one before it. So if we compare Gen Z versus Millennial groups, we can confirm that this group is not quite religious as its predecessors.
(Survey Center on American Life)
5. 21% of American Gen Z individuals identify as atheist or agnostic.
This compares to 15% for millennials. While Gen Z religion statistics indicate that many from this generation identify as non-religious, it doesn’t necessarily mean atheist, with some maintaining a cultural affiliation to a particular religion and others creating their own form of spirituality.
(Pacific Standard)
6. 40% of Gen Z members in the US attend church weekly.
Participation in formal religious activities is not one of the common Gen Z traits. On the contrary, it’s much less popular among young people than it was for the older generations. So 57% of baby boomers claim they attended religious ceremonies once a week during their childhood. About 45% of millennials could confirm the same.
(Survey Center on American Life)
7. 74% of those belonging to the Gen Z generation said they no longer identified with their formative religion when they were 17 or younger.
Gen Z religious statistics show that around three-quarters of young Americans (18-29 years old) stopped identifying with their religion at 17 years old or less. Moreover, 26% left before their teenage years. For previous generations, it was more typical for them to leave religion when they were in college or older.
(Survey Center on American Life)
Generation Z: Mental Health Statistics
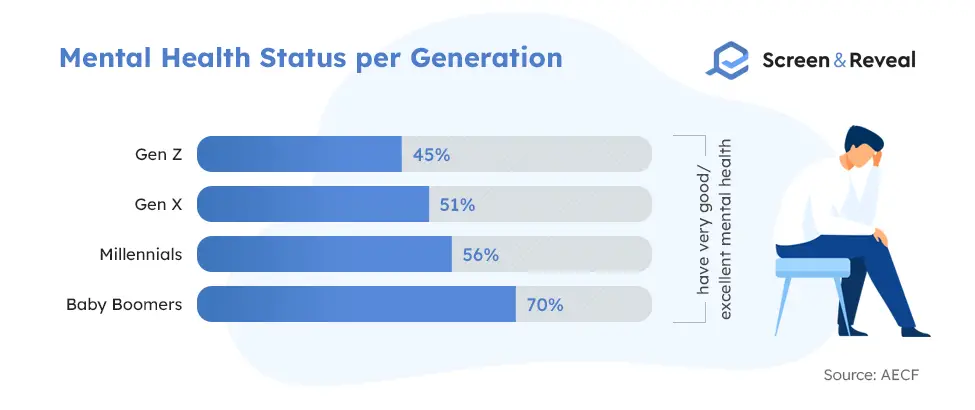
8. Only 45% of Gen Zers report they have very good mental health.
Based on the APA’s stats, one of the most common Generation Z negative characteristics is the abundance of stress. Less than half of surveyed individuals claimed they had excellent or very good mental health. On the other hand, all other generations registered better results. Gen Z seems to be the most depressed generation in history; however, they are more likely to seek out therapy. About 37% of them said they have visited a mental health professional, much more than other generations.
(AECF)
9. 57% of Gen Zers versus 45% of all adults claim deportation of immigrants and their families is a source of significant stress for them.
In line with the Gen Z stress statistics, members of this group tend to feel more stressed than other adults about the stuff in the news. For example, the separation of immigrants and their families and deportations bother them a great deal (57% vs 45% for all other adults). Similarly, sexual harassment and assaults cause significant stress to them (53% vs 39% for all other adults).
(APA)
10. 48% of LGBTQ members of Gen Z claim they were unable to receive mental health counseling in 2020.
Although most Gen Zs are less prone to stigma about mental health issues, there are some leftovers in this sense, still bothering these individuals. So a report from 2021 reveals some devastating Generation Z stats. Namely, suicide attempts among LGBTQ Gen Zers were lower among those who managed to change their name or gender on their documents. Further, they were lower for those whose pronouns were respected or who accessed places that reaffirmed their sexuality and gender identity. That said, some 42% of LGBTQ Gen Zers considered a suicide attempt in 2020.
(Medical News Today)
11. One in four members of Gen Z feels emotionally distressed.
About 25% of young people belonging to this group feel poor emotionally. Gen Z mental health statistics reveal that this is almost double the Millennials (13%) or Gen X (13%). Moreover, it’s triple more than baby boomers (8%). COVID-19 hasn’t actually improved the situation, rather, it has made it worse.
(McKinsey)
12. Nine in 10 adults from Gen Z experienced at least one emotional or physical symptom of stress.
Roughly 91% of Gen Zers feel some symptoms of stress. Namely, 58% felt depressed, and 55% lack of motivation and energy, Generation Z depression statistics indicate. Only half of them actually feel like they do sufficient to handle this stress.
(APA)
13. 58% of Gen Z have two or more unmet social needs.
One of the common characteristics of Generation Z is that they claim to have at least several unmet social needs. In fact, it’s more than any other generation before them. Only 16% of people from these generations claim the same. These often include food, housing, transportation, education, employment, income inequality, safety, and so on. As a result, these unmet needs result in poor mental health, or people with poor mental health are more likely to report these needs as unmet.
(McKinsey)
14. 54% of Gen Z women feel stressed all or most of the time.
Gen Z mental health stats show that compared to men, Gen Z women feel more stressed in general. Unlike women, only 39% of men from this age group feel stressed all or most of the time.
(Deloitte)
15. 53% of Gen Zers think discrimination based on mental health often happens in their country.
Over half of surveyed members of this generation feel like the state of someone’s mental health is the reason for their discrimination. 50% of millennials also agree with this statement.
(Deloitte)
Gen Z Political Statistics
16. Half of the oldest members of Gen Z said that someone from their household had lost a job during coronavirus.
Millennials came of age during the Great Recession, but Gen Z have come into a strong economy with significantly high unemployment. On top of that, COVID-19 has shifted the political, economic, and social landscape of the country, and now Gen Z stands before the uncertain future. Despite that, Gen Z behavior is positive toward progressive forces; they are pro-government and consider the growing ethnic diversity in the country a positive thing. Moreover, out of all generations, they are least likely to consider the US superior to other countries.
(Pew Research)
17. 65% of those between 18 and 24 years old voted for Biden in the 2020 elections.
A record number of Americans voted in the 2020 presidential elections. Similarly, a record-high number of votes went to Joe Biden, who received 5.5 million more votes than Donald Trump. Biden received 11% more votes from GenZs than from any other generation, from the Generation Z political statistics show.
(CNBC)
18. 87% of Gen Zers in the US are worried about the environment.
Before the pandemic, Amnesty International conducted a poll on a sample of 10,000 Gen Z individuals worldwide to determine what they consider the most important issues. Global warming garnered the highest number of votes (41%). As many as 93% of them meanwhile think brands have an obligation to take a stand on environmental matters.
(AECF)
Generation Z Social Media Usage Statistics
19. 65% of Gen Z consumers have increased their use of social media in the last few years.
Gen Z social media usage has been growing exponentially over the last few years. It is one of the generations that is extremely present online. As a result, 45% of individuals from this group expect it to continue over the next couple of years.
(SproutSocial)
20. 80% of Gen Z on social media follow at least one influencer.
According to Gen Z social media statistics, influencers play an important deal for this generation. In fact, representatives from this age group follow at least one across multiple platforms, including TikTok, YouTube, or Instagram.
(Earthweb)
21. One in 10 people fails social media screening, especially in the millennial and Gen Z age groups.
By oversharing on social media, Gen Z and millennials risk failing future social media background checks by employers. These two are especially sensitive groups due to the combination of the inexperience of youth and the permanence of the Internet.
(Good Egg)
Gen Z Education Statistics
22. 50% of more Gen Zers are open to something more than 4-year college.
The majority of today’s students are Generation Z born between the mid-1990s and early 2010s. These digital natives have higher expectations of schools’ technical savvy and more preferences for their college experience.
(Lead Squared)
23. 70% of high schoolers want to follow their own path in education.
Gen Z education stats show that students today are strong in their opinion that they have to forge their own path in education. Less than one-quarter agree with the traditional form of four-year college education and that it is the only road to a good job. However, there are many obstacles, including how to complete non-traditional education verification.
(Lead Squared)
24. Almost 75% of surveyed high school students claim that paying back student debt is their highest worry.
Gen Zs are hesitant when it comes to taking up loans to complete 4-year traditional college degrees. They need more time to evaluate their needs and interests, and their aversion toward student loans is more than apparent. Gen Z college statistics show that up to one-third say the financial fallout from the pandemic will sway them away from pursuing a 4-year degree.
(Lead Squared)
25. 86% of Gen Z believe that colleges should have social media accounts.
One of the things Gen Z does is interact with educational institutions online via social media. Instagram has emerged as this generation’s preferred platform, while the use of Facebook continues to decline.
(Lead Squared)
Gen Z Online Shopping Stats
26. Over 30% of Gen Z and 36% of millennials plan to shop less in brick and mortar stores.
In line with the latest Generation Z trends and millennial spending statistics, a lot of members of these groups will shop more online in the future. For these two, ecommerce is more attractive than ever, with 28% of Gen Z and 24% of millennials saying they shop online more often.
(Kibo)
27. 52% of Gen Z named price comparison as one of the top online shopping benefits.
Unline Gen Zers, for Millennials it’s more about the convenience (55%), Gen Z shopping online statistics indicate. Social media is a big influence on online shopping, so 64.2% of Gen Z said that they get their inspiration on Instagram. Compared to them, 39.1% of millennials claim the same. Moreover, Gen Z would more likely pay for sustainable fashion (41%), while 73.9% of millennials think it’s important that brands are supporting diversity and equality.
(Kibo)
28. Only 19% of Generation Z are willing to buy on credit.
According to the Gen Z consumer trends, most of them witnessed their parents enduring financial struggles during the Great Recession in 2008. As a result, they are economical and sensitive to prices, Gen Z shopping statistics indicate. Only some 19% are ready to buy on credit, as opposed to millennials, where 30% are willing to do so.
(Apptus)
29. 68% of Gen Zs want brands to contribute to society.
Gen Zers are more inclined to sustainable shopping in every sense. So they want their brands to help society. Moreover, 61% would rather choose a brand that treats their personal info with more responsibility. That’s why 75% of Gen Z customers prefer Amazon over Walmart and eBay when shopping online.
(Thrive My Way)
Gen Z Travel Statistics
30. Gen Z travels for approximately 29 days per year.
Although Gen Z spending power allows this generation to travel more often than some earlier generations, Millennials remain at the top as the generation that travels most. For reference, they spend 35 days per year traveling. Gen Z travels more than baby boomers and Generation X and is slowly catching up on the millennials. When it comes to international travel, over half of Gen Z plan to travel like this, compared to 35% of millennials.
(Hotelmize)
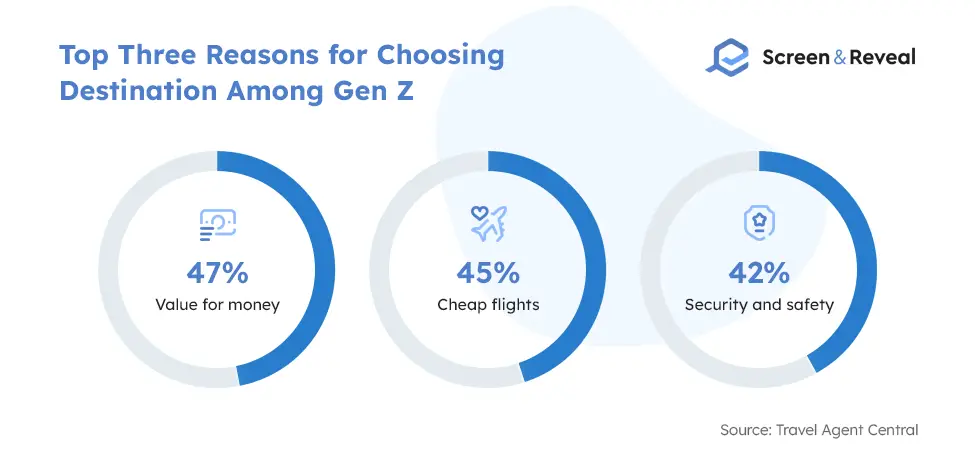
31. Among Gen Z, value for money is the top reason for choosing a destination, with 47%.
In line with the latest survey on Generation Z travel, statistics reveal interesting results on what drives Gen Z to choose a destination. Similarly, one in three Gen Z respondents said that they would most likely choose a four or five-star hotel. Some 30% would choose the budget hotels.
(Travel Agent Central)
32. 38% of Gen Z travelers consider unique experiences to be a must-have thing on vacations.
Generation Z is not so eager, such as millennials for unique experiences on vacation for it to be great. Namely, 48% of millennials claim that this is essential for a vacation to be put on a ‘best even’ list. This compares to 38% for Gen Z.
(Hotelmize)
Gen Z and Technology Statistics
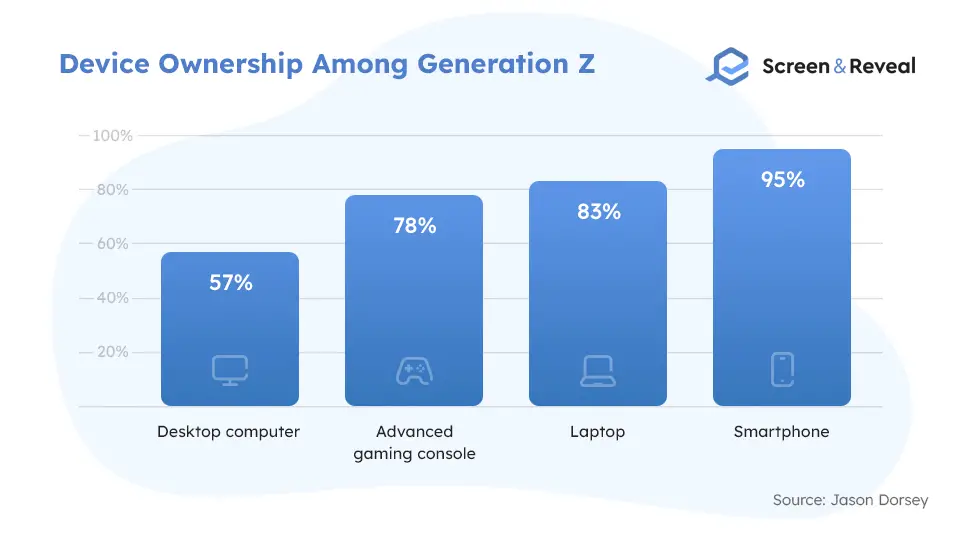
33. 95% of Gen Z own a smartphone.
This generation is full of digital natives. Generation Z and technology go hand in hand almost all of the time.
(Jason Dorsey)
34. 74% of teenagers spend their free time online, Gen Z technology statistics show.
Most Gen Z’s spend their time online. About 28% of them use the Internet to learn new things. The average Gen Z user streams 23 hours of videos a week.
(Thrive My Way)
35. 66% of Generation Z uses several devices at a time.
In fact, one in five teenagers recycles electronics. However, if they have to choose one device over another, 75% of Generation Z prefer smartphones to desktop computers.
(Thrive My Way)
Gen Z Workforce Statistics
36. Gen Z accounts for a small part of the US workforce, only 11.6% in 2020.
Generation Z workforce is still relatively small, considering that the oldest from this group is only 24 years old. However, with them growing up, they might be as much force as their predecessors, millennials in the workforce statistics indicate.
(Great Place to Work)
37. 38% of Gen Z find work-life balance extremely important.
Returning focus on some traditional components of work like health insurance and salary is one of the main traits of Gen Z in the workplace, statistics show. Namely, other than work-life balance, 58% would work more during weekends and nights if it gets them more pay. For 65%, salary is important, while 70% name it one of the top employee benefits. Also, 70% claim that health insurance is necessary for them to apply for or stay in the job, employee retention statistics reveal.
(Workest)
38. 83% of surveyed Gen Z individuals claim that a company’s values are what makes a difference for them.
The Gen Z work ethic is tied to the company’s values. Namely, most of them prefer to work for a business that is committed to inclusion and diversity. Employee engagement statistics show that companies that work hard on being a good place to work for everyone have a solid foundation for attracting fresh talent.
(Workest)
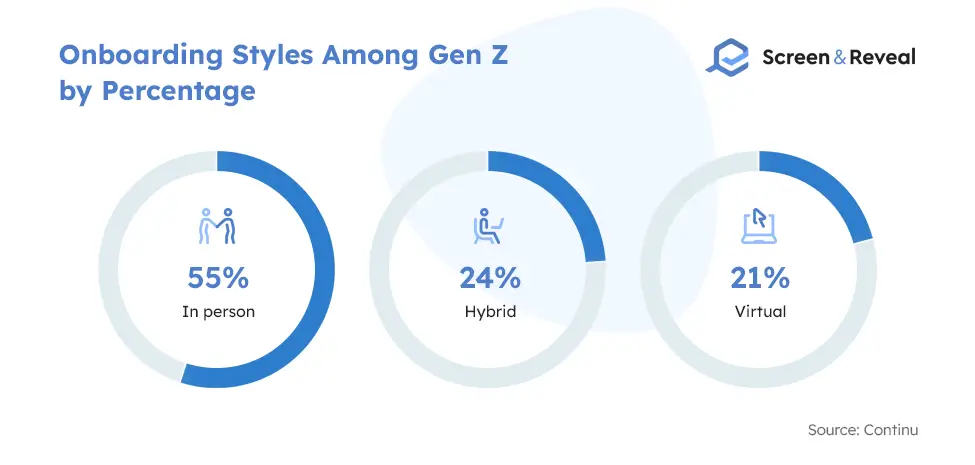
39. Onboarding has decreased anxiety levels for 62% of new Gen Z employees.
Onboarding is a vital factor for Generation Z in the workplace, statistics confirm. Some 62% of them said that it equipped them with skills and resources to perform better at their job, employee onboarding statistics show. About 67% of Gen Z agree that it also made them feel welcome in the new company.
(Continu)
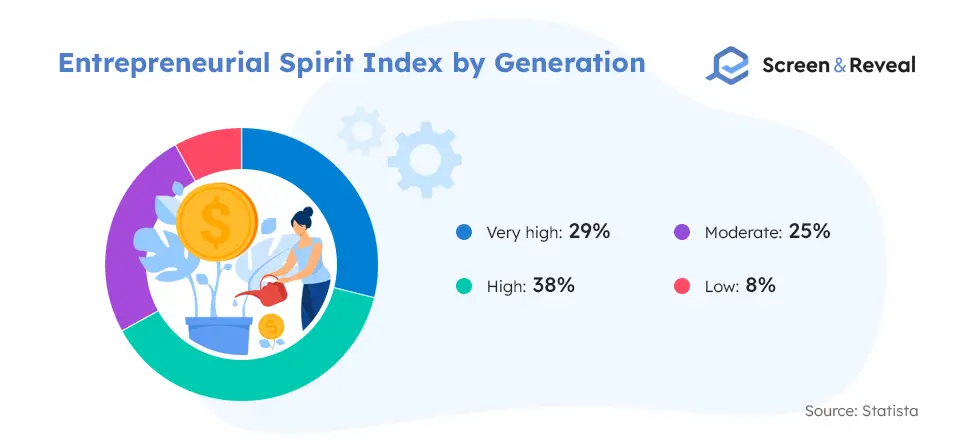
40. 29% of Gen Z has a very high entrepreneurial spirit index.
It would seem that generation falls behind on entrepreneurial aspirations. For Generation X, those with a very high index are 33%, while for millennials, the number is 36%, millennial entrepreneurship statistics show. Only baby boomers underperform Gen Z with 25%.
(Statista)
Gen Z Statistics on Consuming
41. Gen Z accounts for $43-44 billion of direct spending.
Thanks to Generation Z spending habits, teens directly affect $75 billion of discretionary spending. Moreover, they strongly influence over $200 billion worth of sales. Mostly, they spend on themselves.
(Trifecta)
42. In 2021, there were 37.2 million digital buyers among the US Gen Z population.
Gen Z spending statistics show that in 2021, about 78.7% of the Gen Z population bought something online. They are on the path to becoming the largest consumer group in the US. For example, predictions show that in 2025, 85% of the total Gen Z population will be digital buyers (55.5 million consumers).
(Insider Intelligence)
43. Gen Z is on track to lose $10 trillion of life-cycle earnings due to COVID-19.
Generation Z purchasing behavior could be under effect by the pandemic a great deal. The pandemic has put a break on their economic growth. The World Bank estimated that it would affect their financial future similarly to the Great Recession and millennials, Gen Z financial statistics reveal.
(Business Insider)
44. 54% of Gen Zers in the US said they have been saving more since the pandemic.
The spending habits of Gen Z have been curbed by the pandemic, resulting in more savings. While 38% said they opened an online investment account, 39% opened an online bank account.
(Business Insider)
45. Gen Z’s disposable income in the US hit $360 billion in 2021.
Gen Z income statistics show that this figure is a sum of what this generation of individuals earns from their employment ($263 billion), the income they generate from side jobs ($40 billion), and money from their parents ($57 billion).
(Cision PR Newswire)
46. Gen Z’s credit score jumped 13 points between 2019 and 2020.
For instance, in 2019, they had 641 points, while in 2020, it grew to 654, thanks to fewer missed payments than all other generations, among other reasons. Gen Z consumers are maybe inexperienced and new to the market, but they are showing promising signs on how to manage their credit, including using assistance from credit repair companies when needed.
(CNBC)
Gen Z Dating Statistics
47. 75% of surveyed Gen Z said they were not dating during the pandemic.
A study on dating that comprised 45% of Gen Z demographics revealed interesting results. Most of the members of this group refrained from dating during the pandemic. For most, it was due to wanting to take time for themselves to figure out their needs better before going after a relationship.
(BBC)
48. 85% of Gen Z said they have been sexually active since 18 years old.
Gen Z sex statistics show that despite that, those between 20 and 24 years old were more likely to remain sexually inactive compared to Gen X and millennials. In fact, 15% said they were indeed sexually inactive, while only 6% of those from Gen X said the same about the time they were at that age.
(Newsweek)
Generation Z Drug Statistics
49. 23.6% of 12th graders use illicit drugs.
The demographics of Gen Z are typically susceptible to substance abuse, in fact, more than other groups. Other than that, a report from the NIAAA suggests that over 4.2 million people between 12 and 20 have admitted to binge drinking.
(Addiction Center)
50. Half of Gen Z and millennial workers have used drugs, alcohol, or prescription medication.
A study from 2020 shows that these two groups are more likely to miss their job due to treatments for mental health. Gen Z typically struggles with substance abuse, Gen Z drug use stats show. Therefore, employers have to put a higher emphasis on pre-employment drug screening.
(Business Wire)
51. 90% of substance use disorders begin in the teenage years.
This puts Gen Z in a very sensitive place. For reference, one in six teens has used prescription drugs to get high or improve their mood. About 6% of parents confirm this, while 10% of teens admit it. Many say it’s due to Gen Z’s problem with loneliness or their obsession with social media.
(Addiction Center)
Wrapping Up
As Generation Z is stepping onto the stage as the new consumers, marketing, as well as employment strategies, are shifting. These are just some crucial Gen Z stats to help you navigate these new waters successfully.
FAQ
What years are Gen Z?
Based on the latest research by Pew Research Center and general consensus, those aged 10 to 25 belong to the Gen Z range. These are individuals born between 1997 and 2012.
(Beresford Research)
When did Gen Z start?
Marking a clear border between two generations is hard. Although they have some approximate boundaries in terms of years when one ends and another begins, it’s not an exact science. Gen Z stats generally take 1997 as the year when the first Gen Z individuals were born.
(Pew Research Center)
What’s the next generation after Gen Z?
Since the alphabet ends with Z, but there are more generations coming our way, author Mark McCrindle coined the name Generation Alpha. This age group comprises all born between 2012 and 2025 and is on the path to being the most educated, tech-savvy, and wealthiest generation so far.
(AIHR)
Why is Gen Z called Gen Z?
Despite the common belief that the Z in this term stands for something particular, it’s not the case. Instead, this term is supposed to differentiate them from Generation X and millennials who were for some time referred to as Generation Y. Stats about Gen Z confirm this, indicating that this stands for nothing specific.
(Flashmode)
How many Gen Z are there?
This is one of the largest generations ever. For instance, solely in Australia, they comprise 20% of the population. Globally, this percentage rises to nearly 30%. That means that there are about two billion individuals worldwide belonging to this group.
(McCrindle)
How is Gen Z different from other generations?
Based on the Gen Z statistics, one crucial difference that sets these individuals apart from other groups is that they have grown completely in the digital world. From the very beginning, they are adapted to the mobile-first and have more knowledge of technology than older generations can’t boast. As a result, they have higher standards on how they spend their time on the Internet.
(Insider Intelligence)
Sources: Insider Intelligence, Pew Research, HubSpot, Survey Center on American Life, Pacific Standard, AECF, APA, Medical News Today, McKinsey, Deloitte, CNBC, AECF, SproutSocial, Earthweb, Good Egg, Lead Squared, Kibo, Apptus, Thrive My Way, Hotelmize, Travel Agent Central, Jason Dorsey, Great Place to Work, Workest, Continu, Statista, Trifecta, Business Insider, Cision PR Newswire, CNBC, BBC, Newsweek, Addiction Center, Business Wire, Beresford Research, Pew Research Center, AIHR, Flashmode