More and more people are turning to entrepreneurship to build a better life for themselves and their families. As the global economy continues to evolve, the need for well-rounded entrepreneurs is only increasing.
With that in mind, it’s essential to understand what trends are currently shaping the entrepreneurial landscape. After all, knowing where things stand can help you make informed decisions about your business ventures and aspirations.
So, what do the latest entrepreneurship statistics tell us? Let’s dive in!
Entrepreneurship Stats (Editor’s Picks)
- There are 528 million business owners across the world. (The Hill, The World Bank)
- There are 30.7 million small businesses in the US. (SBA Office of Advocacy)
- The vast majority of millionaires and billionaires are self-made. (Forbes)
- 97% of business owners wouldn’t return to traditional employment. (Freshbooks)
- 30% of entrepreneurs have only finished high school. (Apollo Technical)
- 20% of businesses don’t make it past the first year. (QucikBooks, Lendingtree)
- 65% of business owners say financial issues forced them to close. (Xero, CBINSIGHTS, NBER)
- Young individuals are more entrepreneurial than older generations. (GEM)
Entrepreneurial Statistics
1. Approximately 15.6% of US adults are entrepreneurs.
That equals around 31 million entrepreneurs in the US. Business owners are increasingly gravitating towards technology, and as a result, the Total Entrepreneurial Activity (TEA) in the finance, real estate, and business services sectors for the first time in US history surpassed the rate in wholesale/retail industry—27% compared to 26%, respectively.
(Babson Thought & Action)
2. There are around 30.7 million small businesses in the US.
Small business success statistics unveil that small businesses comprise 99.9% of all businesses in the country and play an essential role in the US economy, providing jobs for 59.9 million employees, or nearly half (47.3%) of the workforce.
(SBA Office of Advocacy)
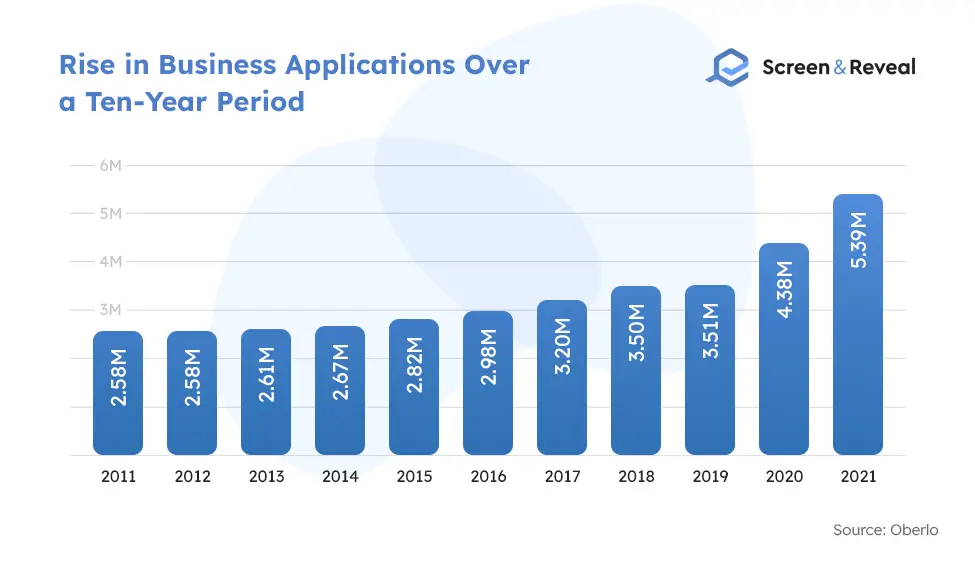
3. US entrepreneurship statistics unveil 5,388,994 new businesses were registered stateside in 2021.
Despite the pandemic, entrepreneurship has been on the rise in the US. The 23% surge in new businesses marked the highest number of new companies registered in one calendar year in the past 15 years. With entrepreneurship showing steady growth since 2014, except during the Great Recession, there’s no doubt that young businesses play an important role in the US economy, as further confirmed by entrepreneurship growth statistics.
(Oberlo)
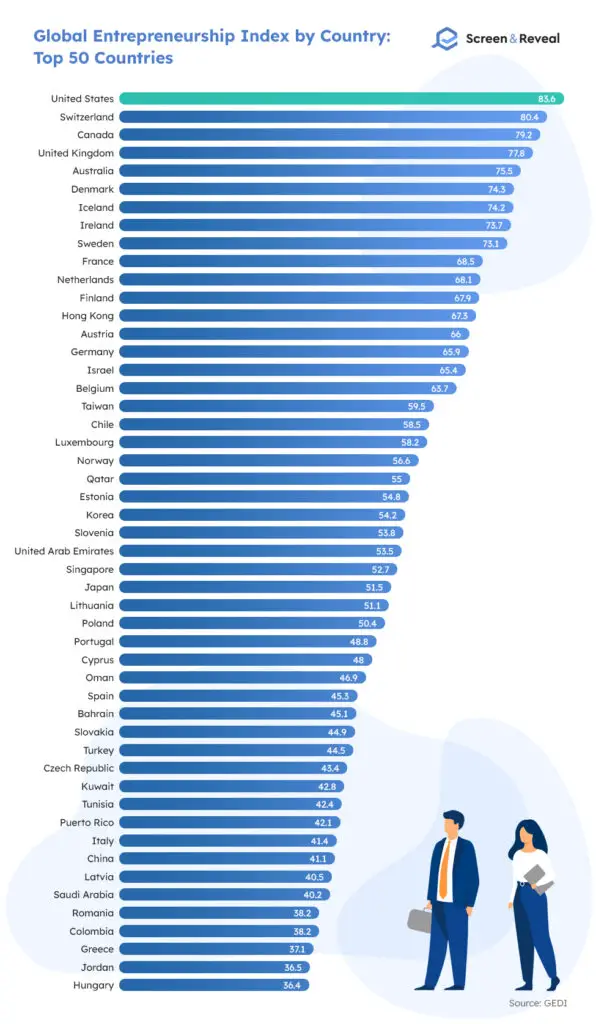
4. The US has the highest Global Entrepreneurship Index (GEI) — 83.6 — making it the best country for entrepreneurs.
This index represents the business climate a country nurtures for the development of small businesses. Switzerland holds the second position with GEI of 80.4, followed by Canada, the UK, and Australia.
(GEDI)
5. 90% of the US billionaires are self-made.
The Covid-19 pandemic has brought many novelties, including a record-high of 493 new billionaires. An impressive 88 billionaires come from America, and what’s even more impressive—all of them are self-made. For comparison, the total number of billionaires in the world is 2,755.
(Forbes)
Success and Failure Entrepreneurship Statistics
6. 58% of successful entrepreneurs came from Corporate America.
The majority of established entrepreneurs in America have corporate experience. Despite the experience in the corporate world, successful business owners value downtime, are on top of their finances, have a positive attitude, support their community, and are willing to spend money on their business.
(Xero)
7. 30% of American entrepreneurs are serial entrepreneurs.
These entrepreneurs who own multiple businesses typically run three ventures over the course of their careers. The majority of business owners (70%), on the other hand, are running their first business.
(Freshbooks)
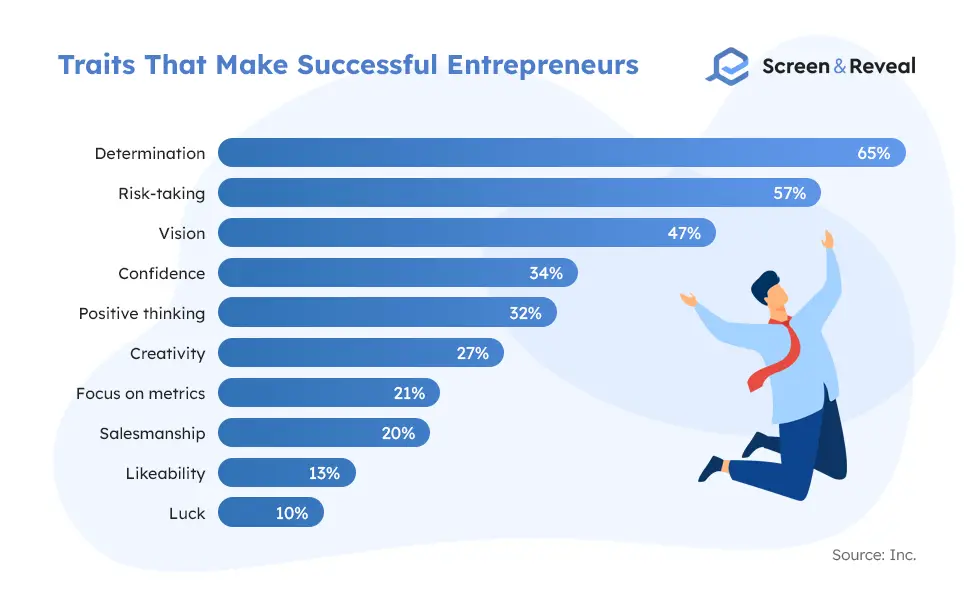
8. Entrepreneurs see determination as the most important trait for their success.
Statistics of successful entrepreneurship businesses show that with 65%, a determination is key to building entrepreneurial success, followed by risk-taking, vision, and confidence.
(Inc.)
9. 97% of business owners wouldn’t go back to traditional employment.
Employee engagement statistics show that business owners express higher career satisfaction than employees with traditional jobs (71% vs. 61%). Satisfaction grows with age as self-employed professionals achieve better work-life balance, improved health, and higher income.
(Freshbooks)
10. Two-thirds of entrepreneurs agree that the first year is the toughest.
New businesses face a myriad of challenges initially, and 20% don’t survive past their first two years. Entrepreneurial facts suggest that half of new companies fail by the end of their fifth year, and only a third stay for a decade. The percent of entrepreneurs that fail is pretty consistent even in times of economic downturn, except for smaller ventures with fewer than five employees that fail at a greater rate during recessions.
(QucikBooks, Lendingtree)
11. 65% of entrepreneurs blame financial issues for failure.
Reasons like limited access to capital or cash flow issues are the most cited financial reasons for an increase in the entrepreneurship failure rate. Regarding venture-capital-backed companies, 42% of owners cite failure to find a market niche as a reason, while 29% say they have run out of money. On the bright side, entrepreneur facts show that venturers with a failed business behind them are more likely to succeed in their second attempt.
(Xero, CBINSIGHTS, NBER)
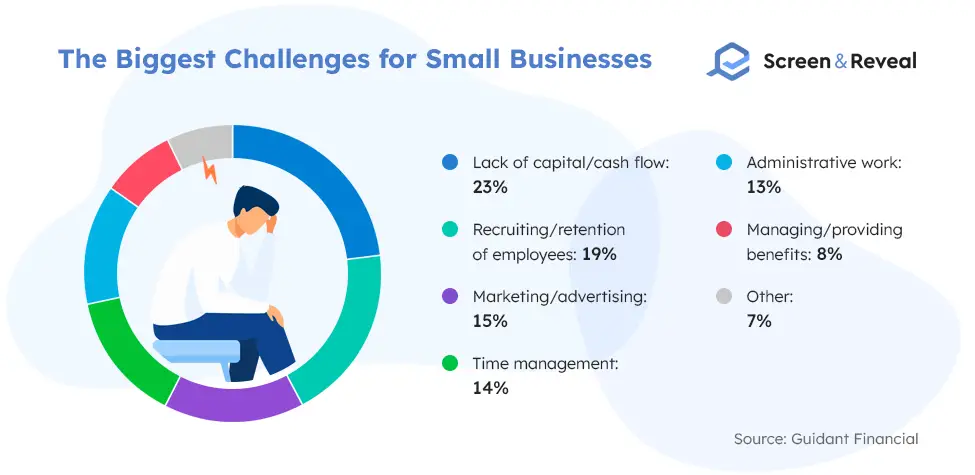
12. Lack of capital or cash is the biggest challenge for most small business owners.
Even without the pandemic, small business ownership comes with many other challenges. Lack of capital or cash flow remains the biggest struggle for small business owners for many years in a row. Recruiting and preserving talent has jumped to the second position, reporting a 17% increase from last year. Marketing and advertising have seen a 7% increase from last year, with 15% of small business owners experiencing challenges with it. Managing and providing benefits is close to the bottom of the list, according to entrepreneurship stats, yet this category has reported a 20% increase from last year.
(Guidant Financial)
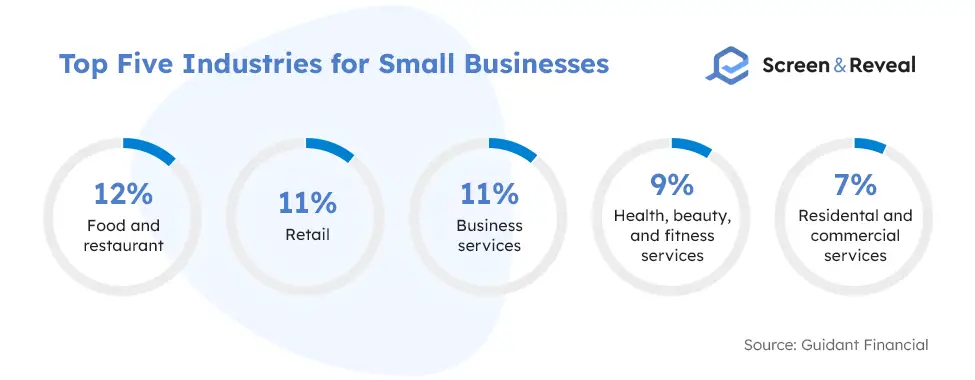
13. Food and Restaurant is the most popular industry for small business owners.
Small businesses stateside are most represented in food places and restaurants, and different types of shops including ecommerce businesses. Small entrepreneurs are also present in the service industry, offering a myriad of business, health, and fitness services.
(Guidant Financial)
14. 63% of small business owners say the quality of life is more important than money.
Entrepreneur stats unveil that most entrepreneurs (61%) would be satisfied with their achievements if their careers ended today. As many as 59% meanwhile plan to work past 65.
(Freshbooks)
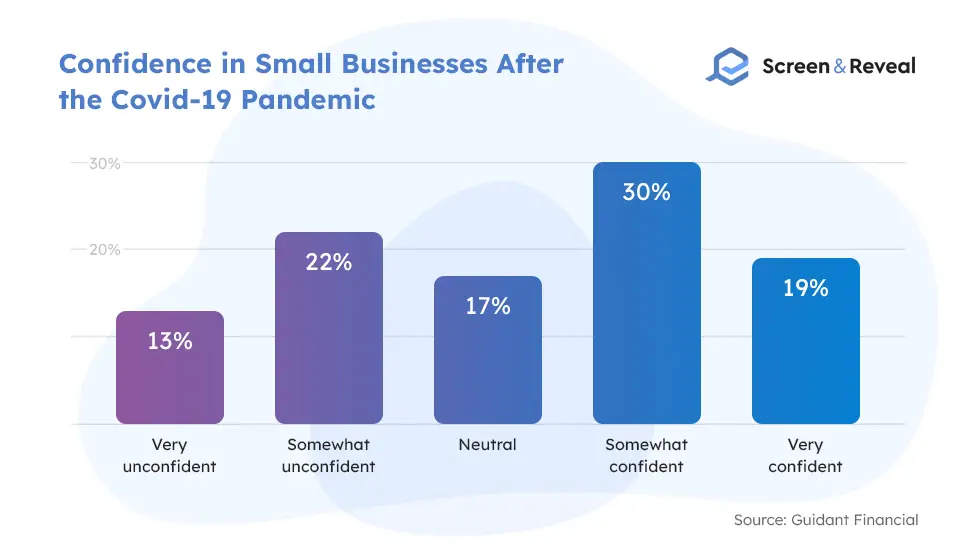
15. Six in 10 US small businesses report being profitable.
Having a business doesn’t equal generating profits. In 2020, 78% of companies reported being profitable, a number that fell to 63% in 2021 due to the pandemic. That said, 78% of business owners hope that their business will survive the pandemic, while only 4% think they will close permanently, statistics on entrepreneurship show.
(Guidant Financial)
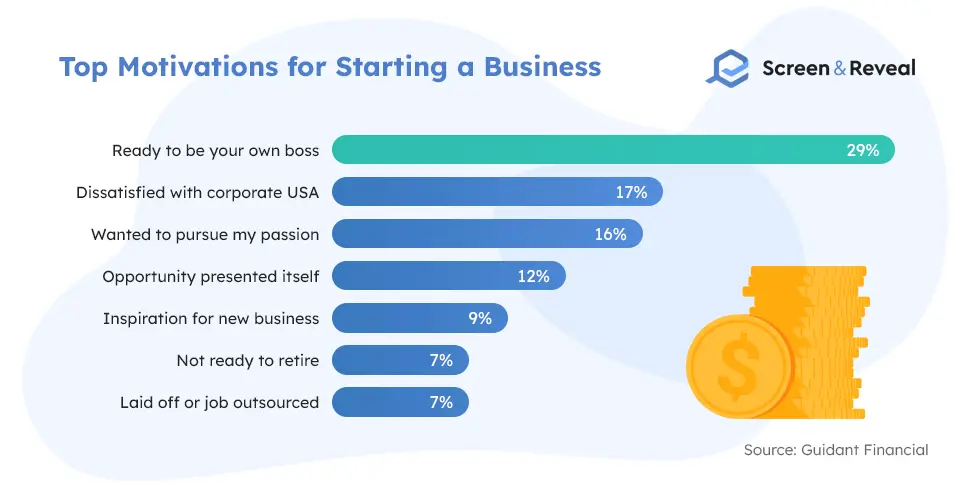
16. The readiness to become their own boss is the primary motivator for individuals to start a small business.
Why employees quit statistics show that dissatisfaction with corporate America comes in second, followed by the desire to pursue their passion, and that opportunity presented itself, inspiration for a new business, unwillingness to retire, and laid-offs.
(Guidant Financial)
17. Entrepreneurship and economic growth statistics show that growing revenue while maintaining headcount is the main goal for most entrepreneurs.
34% of entrepreneurs are mainly focused on growing revenue, 32% intend to concentrate equally on increasing revenue and headcount, 30% want to maintain both revenue and headcount, and only 4% plan to look for a regular job. Those intending to expand their teams can use a helping hand from the top background check companies.
(Freshbooks)
Female Entrepreneurship Statistics
18. An estimated 274 million women globally are involved in business startups.
As many as 139 million women owners/managers worldwide meanwhile are running established businesses and 144 million women are classified as informal investors.
(GEM)
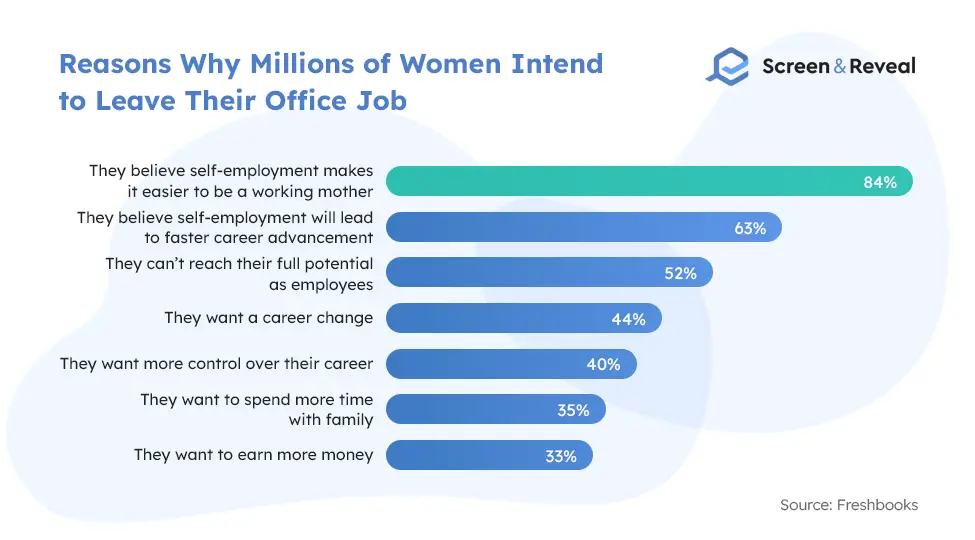
19. Millions of women intend to leave their office jobs.
Women have different reasons for wanting to leave their office positions, but the majority are centered around the better organization of their time as working mothers. Spending more quality time with their families and faster career advancement also play a role, women entrepreneurship statistics show.
(Freshbooks)
20. Women started approximately 1,817 new businesses each day in 2019.
That’s just a bit fewer from 2018’s record-setting 1,821 new women-owned businesses per day in the US. Female-owned ventures now make up 42% of all companies and employ around 9.4 million people. These successful entrepreneurs contribute to the economy by generating approximately $1.9 trillion.
(American Express)
21. More than half of all female-owned businesses belong to three industries.
Female entrepreneurship statistics show that Other services, predominantly beauty and pet care, account for 22% of all women-owned businesses or 2.8 million firms. Healthcare and social assistance businesses account for 15% (1.9 million) of all female-owned companies. Professional/technical/scientific services are the third most popular industry for women, with 13% (1.6 million) of all female-owned businesses. The industries with the most women-owned businesses don’t produce the highest revenue generated by businesswomen. Wholesale trade with 17%, retail trade with 14%, and professional/technical/scientific services with 10% are the leading revenue generators in the women entrepreneurship space.
(American Express)
22. Nearly 100% of women entrepreneurs prefer self-employment over traditional employment.
Entrepreneur facts uncover that 70% of female entrepreneurs claim they make as much money as employees, but 70% report better work-life balance, 60% report healthier lifestyle, and 52% say they are less stressed about work, indicating they enjoy self-employment more than working for another company.
(Freshbooks)
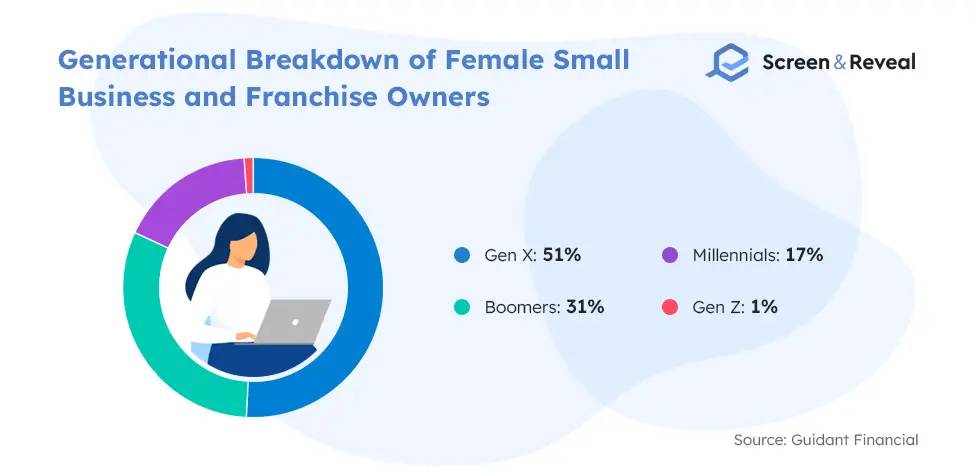
23. Women account for 31% of small business or franchise owners.
Entrepreneurship statistics suggest that over half of female small business owners started their company with less than $50,000, followed by 17% who spent between $50,000 and $100,000 and 9% who invested up to $175,000. An impressive 22% spent between $175,000 and over $1 million, and only 2% cashed out over $1 million into their new business.
(Guidant Financial)
24. Women entrepreneurship statistics show that female-owned businesses have increased by 21% compared to only 9% for all businesses.
Over the past years, the number of female-owned businesses has grown at a higher rate than all businesses, contributing to rising in women-owned employment by 8%, compared to only 1.8% for all businesses. The total revenue generated by female-founded companies also slightly outpaced overall revenue, 21% compared to 20%.
(American Express)
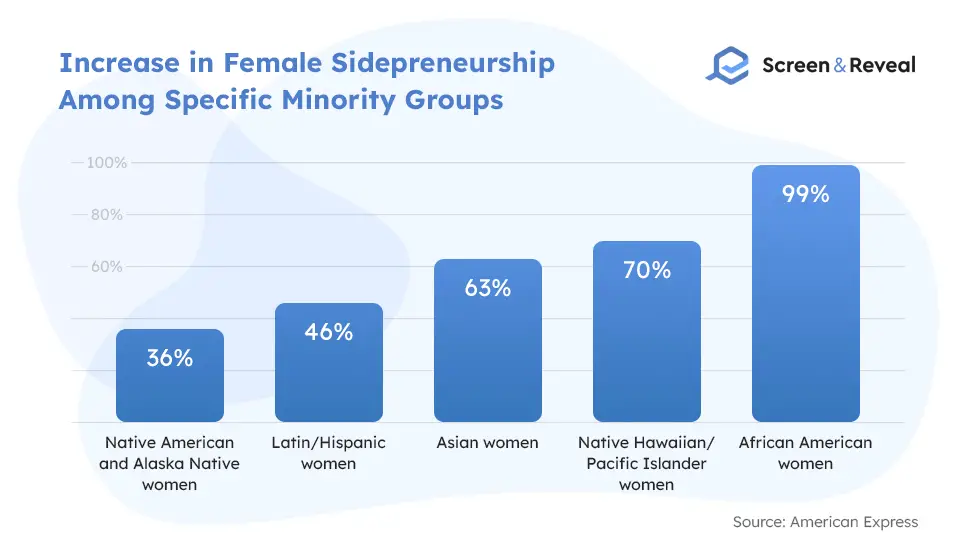
25. Female sidepreneurship has grown twice more than overall female entrepreneurship, 39% vs. 21%, respectively.
Female minorities are most deserving of side hustles’ entrepreneurship growth, with sidepreneurship growing two times more than all businesses, 65% compared to 32%, respectively. Stats about entrepreneurship show that growth in sidepreneurship has increased among many specific minority groups.
(American Express)
26. Self-employed women earn 28% less than self-employed men in the US.
The majority of women feel they can’t reach their full potential as employees. Hence they turn to entrepreneurship. 70% cite workplace discrimination and corporate glass ceiling factors as reasons to start their own business.
(Freshbooks)
27. 30.2% of women entrepreneurs expect to hire six or more employees in the next five years compared to only 18.7% in 2019.
Women entrepreneurship statistics worldwide also reveal that 48% of men expect to expand their teams with six or more employees in the next five years. Small business owners need to be very careful when expanding their teams as even one employee can cost them business. To avoid major losses and damaged reputation they need to partner with the best employment background check companies.
(GEM)
28. Women of color are leading the game in women-owned businesses.
Although women of color account for 39% of the total female US population, they represent 89% of new female business owners. As of 2019, businesswomen of color comprise half of all female-founded businesses, which translates to 6.4 million women of color employing 2.4 million people and supporting the US economy with a revenue of $422.5 billion.
(American Express)
29. Women entrepreneurship statistics worldwide reveal that 17% of women in low and middle-income countries own a business.
Then, 35% aspire to start one. These facts speak that over a half of these women see themselves as entrepreneurs compared to 25% of women from high-income countries.
(GEM)
30. The Total Early-stage Entrepreneurial Activity (TEA) worldwide is 11% for women.
TEA expresses the percentage of the adult working-age population, between 18 and 64, who are either in the process of opening a new business but have not paid wages for more than three months, phase also known as nascent entrepreneurship, or have businesses between three months and 42 months, known as early-stage business activity. Entrepreneurship statistics worldwide indicate that low-income countries are the most entrepreneurial with the highest average TEA entrepreneur success rate for women, 17.1%, compared to 8.9% for high-income countries.
(GEM)
31. Latin America and the Caribbean report the highest TEA for females worldwide.
The TEA for women in Latin America and the Caribbean is 24%, followed by the Middle East and Africa with 16.3%. This compares to Central and East Asia with 9.6%, and Europe and North America with 5.7%, according to statistics on entrepreneurship.
(GEM)
32. Global women entrepreneurship trends suggest Europe has the lowest rates for female entrepreneurship globally.
Europe’s TEA rate for women is 5.7%, relatively low compared to the world average of 11%. Income and cultural differences aren’t the only factors that impact the entrepreneurial spirit among women. For women in countries with stronger economies, business ownership is more of an option. In contrast, women in less developed countries see business creation as a way to make a living and have higher labor participation rates contributing to less pronounced gender gaps, entrepreneurship stats show.
(GEM)
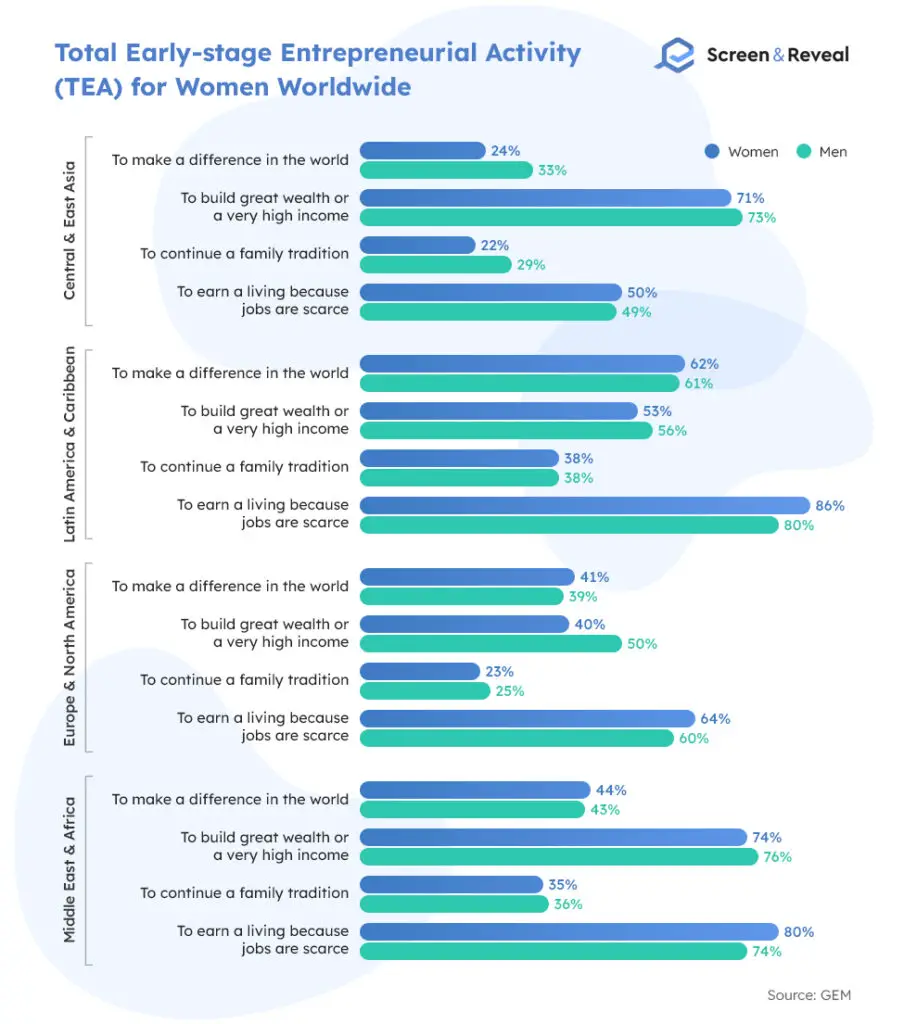
33. Job scarcity is a key motivating factor for women to start a business.
75% of female business owners worldwide claim the lack of job opportunities made them enter the entrepreneurial space. Other motivators among women include the desire to create great wealth and high income, making a difference in the world, and continuing a family tradition.
(GEM)
34. Lack of profit is the main reason for business closures among women globally.
The coronavirus pandemic, issues with getting finances, and various other reasons result in business closures. That said, women are about 10% less likely to report closing a business than men.
(GEM)
Entrepreneurship Demographic Statistics
35. 62% of millennials have considered becoming their own boss.
Families with a history of entrepreneurship have raised a whopping 78% of millennials. The insights into how running a business works have prompted the majority of this generation to consider starting their own business. Also, they can access capital and advice from their closest circles, making them more willing to dive into entrepreneurship.
(OfficeNeedle)
36. Millennial entrepreneurs are the most diverse group of small business owners compared to other generations.
Millennials in the workplace statistics indicate that millennial entrepreneurs are 77% more likely to be African American than Baby Boomer small business owners, and 25% of them are Hispanic compared to 11% for Baby Boomers.
(Forbes)
37. Millennials entrepreneurship statistics suggest this generation comprises 13% of all entrepreneurs in the US.
Female entrepreneurs account for 28% of all millennial entrepreneurs, 12% higher than the national average. If we compare with Baby Boomers, millennial business owners are 22% more likely to be women.
(Guidant Financial)
38. Male millennial entrepreneurs report higher happiness rates.
Entrepreneur demographics is related to happiness levels. Male entrepreneurs report high happiness levels, with 53% rating their job happiness with nine out of 10, compared to 10% fewer women entrepreneurs from the same age group. Generally speaking, 52% of millennial business owners are very happy with their business, millennial entrepreneur statistics show.
(Forbes)
39. A 50-year-old founder is 1.8 times more likely to create a high-growth business than a 30-year-old founder.
The age of entrepreneurs does matter. Young founders in their early 20s are the least likely to have a successful exit or create one in 1,000 top growth companies. In general, those starting a business after the age of 35 have a higher business success rate. There’s also a more significant surge in performance among 46 to 60-year-old entrepreneurs, entrepreneurship demographics statistics show.
(SSRN)
40. Small business owners are getting younger.
Baby boomers are no longer the dominant self-employers, as millennials take the throne. Namely, the average age of new business owners has dropped by four years, going from 38 to 34 years. Furthermore, over half of all entrepreneurs with paid employees (56%) are younger than 45.
(FreshBooks)
Minority Entrepreneurship Statistics
41. White entrepreneurs and men are dominant among entrepreneurs with paid employees.
Men comprise 53% of all entrepreneurs and have a 64% share in the workforce. Asian entrepreneurs are the second-largest racial or ethnic group to own a business. They have the most substantial presence in the accommodation and food industry (25%), retail trade (16%), and other services (15%).
(Pew Research Center)
42. Veterans majority-own 2.52 million businesses in the US.
That translates to 9.1% of American businesses. Of those, 442,485 veteran-owned businesses have employees, while 2.08 million are self-employed individuals. Veteran entrepreneurship statistics show that the economic impact of these businesses translates into $1.14 trillion annual revenue, 5.03 million employees, and $195 million yearly payrolls.
(SmallBusiness.com)
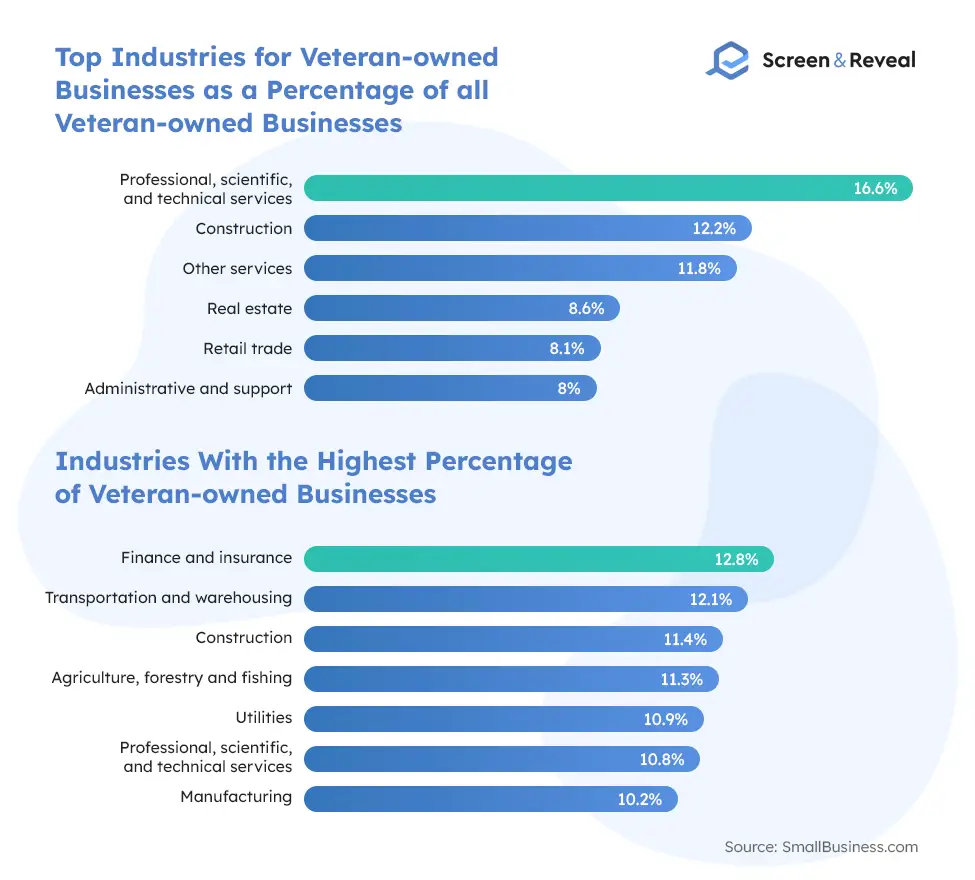
43. The majority of veteran-owned businesses are part of seven industries.
Many veterans opt for the entrepreneurial path, proving themselves to be great business owners who support the economy with trillions of dollars. If we look at the percentage of all veteran-owned businesses, the most popular industries for former active service members include professional, scientific, and technical services and construction. When it comes to industries with the highest percentage of veteran-owned businesses, finance and insurance, and transportation and warehousing lead the game.
(SmallBusiness.com)
44. There are eight million minority-owned businesses in the US.
Of those, 1,054,575 are businesses with employees. Furthermore, 20% of all companies with employers are majority-owned by minority entrepreneurs. Minority entrepreneurship statistics show that these businesses employ 8.7 million people with an annual payroll of $280 billion and annual receipts of $1.3 trillion. Minority-owned businesses average $1.2 million in annual sales.
(SBA)
45. 99.9% of minority-owned employer businesses are small businesses.
Minority-owned businesses employ eight people on average, and 99% have fewer than 500 employees. Minority-owned businesses in the accommodation and food service industry employ the most people (2.4 million), health care and social assistance support 1.4 million employees, and retail trade has 863,000 employees.
(SBA)
46. With 61% minority-owned businesses, Hawaii is the state with the highest percentage of minority businesses.
Statistics on entrepreneurship in the US show that California comes in second with 36%. Texas holds the third position with 30%, followed by New Mexico with 27%.
(SBA)
47. Immigrant entrepreneurs account for 21.7% of all businesses in the US.
Immigrants comprise 13.6% of the population and 17.1% of the labor force but are overly represented among business owners due to their stronger entrepreneurial aspirations. These businesses employ eight million people.
(New American Economy)
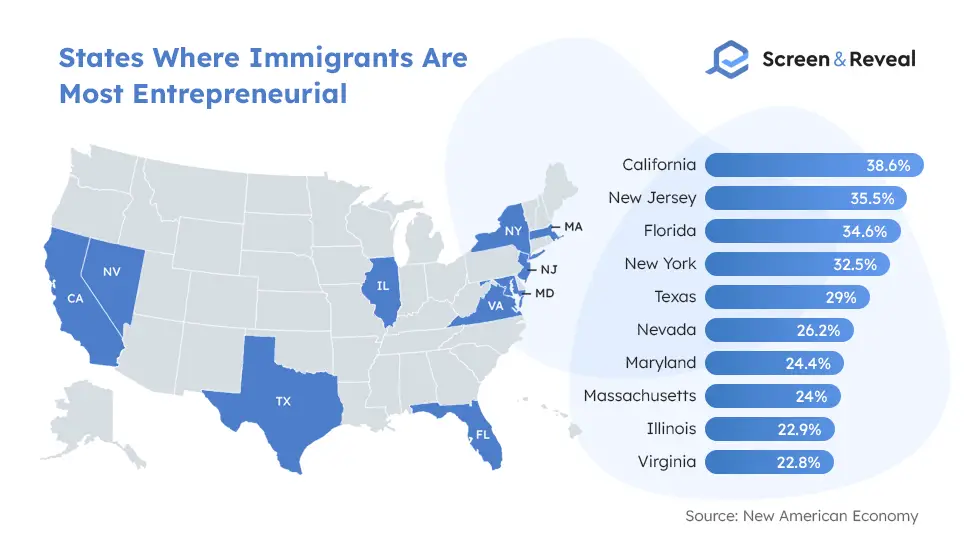
48. 2019 data shows there were 3.2 million immigrant entrepreneurs in the US.
Immigrant entrepreneurship statistics showcase the rate of founding new businesses by immigrants grew by 50% between 1996 and 2011 and declined by 10% for native-born entrepreneurs.
(New American Economy)
49. Young people are more entrepreneurial than adults.
Youth are 1.6 times more likely to have entrepreneurial aspirations than adults. A combination of factors, including a shortage of job opportunities, the financial crisis, and the global economic downturn, has contributed to a rising number of businesses started by young entrepreneurs, youth entrepreneurship statistics show.
(GEM)
50. Young men are 1.3 times more likely to become their own boss than young women.
Young men are also 1.6 times more likely to run mature businesses. They are also twice as likely to employ more than five people compared to young female-owned businesses.
(GEM)
51. Generation Z is the most entrepreneurial generation ever.
Stats on entrepreneurship suggest that individuals born between 1997 and 2021 show the most substantial aspirations to start their own business a whopping 62% have started or intend to dive into the entrepreneurship space. Generation Z statistics also show that this generation is more driven by purpose than sole profits.
(Worth)
52. Black-owned businesses have seen a 38% increase in 2021.
Although the pandemic has hit businesses hard, in 2021, Black entrepreneurship statistics have seen a strong rise, followed by a 15% surge in Hispanic-owned businesses. White and Asian entrepreneurs experienced a 3% and 2% drop, respectively. The positive momentum in Black entrepreneurship comes from multiple factors, especially the “Buy Black” movement popularized all over social media.
(Bloomberg)
53. Women comprise 46% of all Black small business owners, making them the group with the highest percentage of female entrepreneurs.
Younger generations are also more represented among Black entrepreneurs. Only 27% of Black business owners are Boomers compared to 46% white Boomers, 49% belong to Generation X compared to 43% white peers, 21% are Millennials compared to 11% white millennials, and 3% are Gen Z compared to less than one percent white peers.
(Bloomberg)
54. 43% of Black entrepreneurs used only cash to fund their business, making it the most popular financing method among members of this group.
Black entrepreneurship statistics show that 14% used robs, 11% relied on a line of credit, 9% used SBA loan, and 8% had family and friends help them. The majority of Black business owners (59%) have started their business with $50,000 or less.
(Bloomberg)
55. Lack of capital/cash flow is the biggest challenge for Black-owned businesses.
Marketing and advertising is the second biggest challenge for Black-owned businesses, followed by recruiting and retention of employees, administrative work, and managing and providing benefits.
(Bloomberg)
Entrepreneurship Global Statistics
56. There are 528 million entrepreneurs globally.
According to the World Bank’s Ease of Doing Business index New Zealand, Singapore, Hong Kong, Denmark, South Korea, and the United States are the best countries for new businesses.
(The Hill, The World Bank)
57. The majority of the world’s millionaires are self-made.
The self-made millionaire is not a myth if we are to believe entrepreneurship statistics worldwide. As many as 67.7% of wealthy individuals with a net worth over $30 million have made their fortune out of scratch. These self-made millionaires are on the rise, going from 66.4% in 2016 to 67.4 in 2017 and 67.7% in 2018. Nearly a quarter (23.7%) have made it to the top with a combination of their effort and inheritance, and only 8.5% inherited all their riches.
(CNBC)
58. There are around 3.5 million entrepreneurs in Canada.
Entrepreneurship in Canada statistics show that the nation’s entrepreneurs operate in a healthy business ecosystem and are influential globally. There are over 1.1 million small and mid-sized businesses in Canada that employ 10.7 million people, account for 90% of jobs in the private sector, and support the gross domestic product with $1 trillion.
(BDC)
59. Individuals aged 25 – 44 are responsible for 33% of all entrepreneurial activity in Canada.
Two major demographic moments define the rise of entrepreneurs in Canada. First, younger Canadians, Gen Z, and millennials are taking over the business scene, accounting for one-third of all entrepreneurs in the country. Entrepreneurship in Canada statistics show the number of Canadians under 35 years old who have started a business surged by 80% between 2014 and 2018. Second, more older people (age 55 and over) are diving into entrepreneurship. Nearly 5,900 Canadians age 55 or older have become business owners in 2018, up from only 1,900 in 2000.
(BDC)
Education and Entrepreneurship Statistics
60. 56% of business owners had a college degree in 2019.
The number of entrepreneurs in the US with college degrees has been declining over the past few years. Back in 2017, 64% had a college degree, while just a year later, that number had gone down to 60%.
(Freshbooks)
61. High school dropout and entrepreneurship statistics indicate that America’s most frequent business owners are high school dropouts.
Educated individuals have more opportunities for high-paying jobs as they can easily pass an education verification check and sell their expertise for more compared to the least educated who start businesses out of necessity. Most of these businesses are sole proprietorships.
(Economix)
62. High school entrepreneurship statistics show that the Covid-19 pandemic contributed to increased interest in entrepreneurship from high schoolers.
Multiple factors have contributed to high-schoolers being interested in starting their own businesses. The additional free time due to closed schools has left more room for online and flexible learning. The job/career uncertainty and rise of online businesses have also prompted high schoolers to think business.
(Inc.)
63. As many as 30% of entrepreneurs have only finished high school.
There’s no denying that formal education can open many paths, but it doesn’t seem to play a role in entrepreneurship. Nearly a third of business owners in the US have finished high school, followed by 31% with an associate degree, 17% with a bachelor’s degree, 18% with a master’s degree, and only 4% with a Ph.D.
(Apollo Technical)
64. Teen entrepreneurship statistics suggest two-thirds of teenagers would consider starting a business as an adult.
The pandemic hasn’t scared off aspiring entrepreneurs among teenagers. For one-third (29%) of them, the most significant concern is that “it’s too risky,” while nearly one quarter (24%) don’t believe there’s enough money in their idea. More than half of teens (52%) need someone to invest in their business to consider starting one, 47% would need parents and family to support their business endeavors, and 38% would like to team with friends on their business journey. More than a third of teenagers (34%) would need to follow a business role model.
(Junior Achievement)
65. The number of businesses in the UK started by teenagers has gone from 500 to 4,000 in the past 10 years.
Technology startups and online entrepreneurs have fueled youth’s entrepreneurial spirit, with figures like Richard Branson, Steve Jobs, and Mark Zuckerberg cited as most inspirational. Teen entrepreneurship statistics show that teens are most likely to start their clothing or accessory lines, technology, entertainment or media, health and beauty products, food or drink business.
(The Guardian)
66. 9% of students internationally intend to start a business after finishing college.
College graduates typically have more well-paying employment opportunities, making them less interested in starting their own business. Statistics on college student entrepreneurship show that 34.7% of them, however, plan to become entrepreneurs five years after finishing their studies. The general idea among students is “first employee, then entrepreneur.”
(GUESSS)
67. 61% of recent college graduates in the US want to start their own business.
Statistics on entrepreneurs suggest that 45% of students think it’s very likely that they’ll dive into entrepreneurship, and 20% have already started a business while in college. While 30% of the recent grads state it’s improbable for them to become entrepreneurs, they’d still like to. Of those who want to start a business, 45% believe it’s easily possible, yet 67% admit they don’t fully understand the tasks that come with running a business like how to incorporate, how to market their business, prepare a business plan, obtain a domain name or come up with a one-of-a-kind name.
(Zen Business)
Statistics on Stress and Entrepreneurship
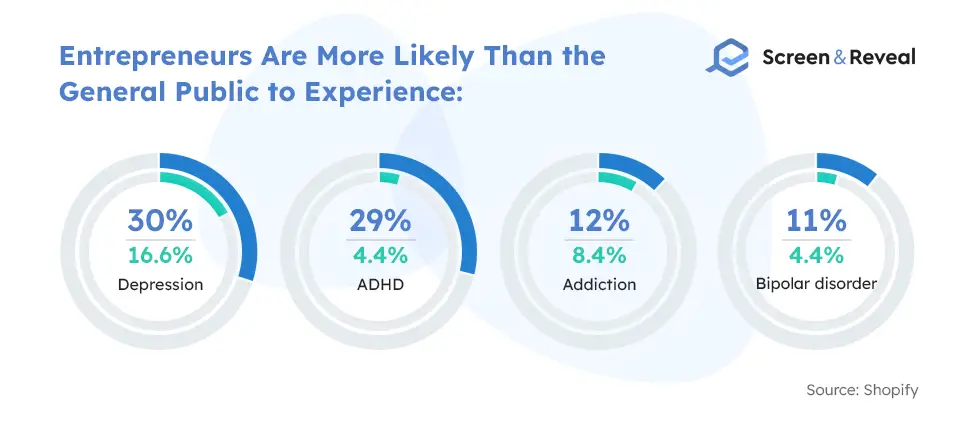
68. Mental health challenges affect 72% of entrepreneurs.
While entrepreneurship is generally perceived as a great career choice, and an opportunity to reach new levels of fulfillment and career advancement, one can’t deny its dark side. A heavy load of responsibilities, multiple problems to solve daily, and the uncertainty that comes from not having a stable, secure source of income are just a few of the things that can cause daily stress and worry for business owners. Entrepreneurs have significantly higher chances than the general population to experience certain mental health issues and addiction—at least the numbers say so.
(Shopify)
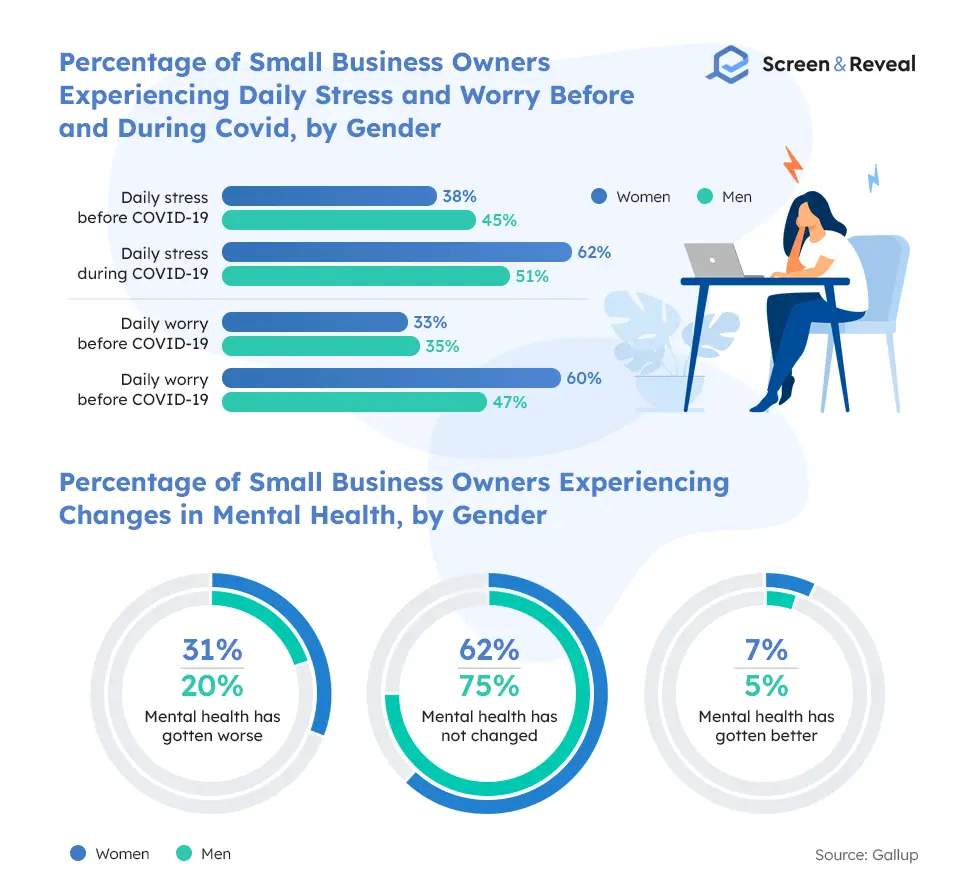
69. Female small business owners report higher daily stress and worry levels than male small business owners.
A Gallup survey has discovered that the Covid-19 pandemic has severely impacted women entrepreneurs’ well-being. Facts about entrepreneurship suggest that 62% of female business owners have reported high daily stress levels, and 60% have reported daily worry. It’s worth mentioning that before the Covid-19 pandemic, women have reported lower levels of daily stress and worry than men.
Overall, 25% of business owners have reported experiencing more mental health-related issues than before.
(Gallup)
Entrepreneurship Stats FAQs
What does an entrepreneur do?
An entrepreneur is someone who starts and runs their own business. They are typically responsible for all aspects of the company, from coming up with the initial idea to making it a reality. Entrepreneurs are often risk-takers, as they put their own time and money into something that may fail. But if their business is booming, they can make a lot of money. There are many different types of entrepreneurs, from those who create new products or services to those who work on improving existing businesses.
How many entrepreneurs are there in the US?
Facts about entrepreneurs suggest that number of entrepreneurs in the US is 31 million, or 15.6% of US adults.
How many businesses are there in the World?
There were approximately 213.65 million companies worldwide as of 2020.
(Statista)
What percentage of entrepreneurs have college degrees?
As of 2019, 56% of US self-employed professionals had college degrees.
What percentage of the population are entrepreneurs?
US entrepreneurship statistics show that 15.6% of US adults are entrepreneurs.
What percentage of entrepreneurs fail?
Entrepreneurship is reserved for the most persistent professionals. Statistics say that 20% of businesses fail in the first year, and nearly half fail by the fifth year.
What percentage of businesses fail in the first year?
Approximately 20% of businesses fail within the first year of doing business.
What is a primary reason why entrepreneurs experience daily stress?
Statistics on stress and entrepreneurship suggest that entrepreneurs experience daily worry and stress mainly because of the considerable amount of responsibilities they have.
How much do entrepreneurs make?
According to different sources, the average annual income for entrepreneurs in America is between $68,000 and $72,000.
(Nerdwallet)
What is a good business for a kid to start?
Kids can start service businesses like car washing, snow removal, lawn care, and other simple activities they can perform in the neighborhood. Some kids are also opting for technology-powered businesses like starting a YouTube channel.
What is the average age of an entrepreneur when they start their company?
Professionals of any age start businesses daily, but entrepreneurship statistics show that the most successful entrepreneurs were 45 years old on average when they founded their companies.
(CNBC)
Sources: Babson Thought & Action, SBA Office of Advocacy, Oberlo, GEDI, Forbes, Xero, Freshbooks, Inc., Freshbooks, QucikBooks, Lendingtree, Xero, CBINSIGHTS, NBER, Guidant Financial, Freshbooks, GEM, American Express, Guidant Financial, OfficeNeedle, Forbes, SSRN, FreshBooks, Pew Research Center, SmallBusiness.com, SBA, New American Economy, GEM, Worth, Bloomberg, The Hill, The World Bank, CNBC, BDC, Economix, Inc., Apollo Technical, Junior Achievement, The Guardian, GUESSS, Zen Business, Shopify, Gallup, Statista, Nerdwallet, CNBC.