The latest sex offender statistics, which, while incredibly worrisome, can provide some much-needed perspective and help people stay vigilant.
Sex Offender Facts and Statistics (The Highlights)
- There are over 786,000 people on the US sex offenders registry.
- Texas is the state with the highest number of sex offenders.
- 10.9% of registered sex offenders have two or more sexual offense convictions.
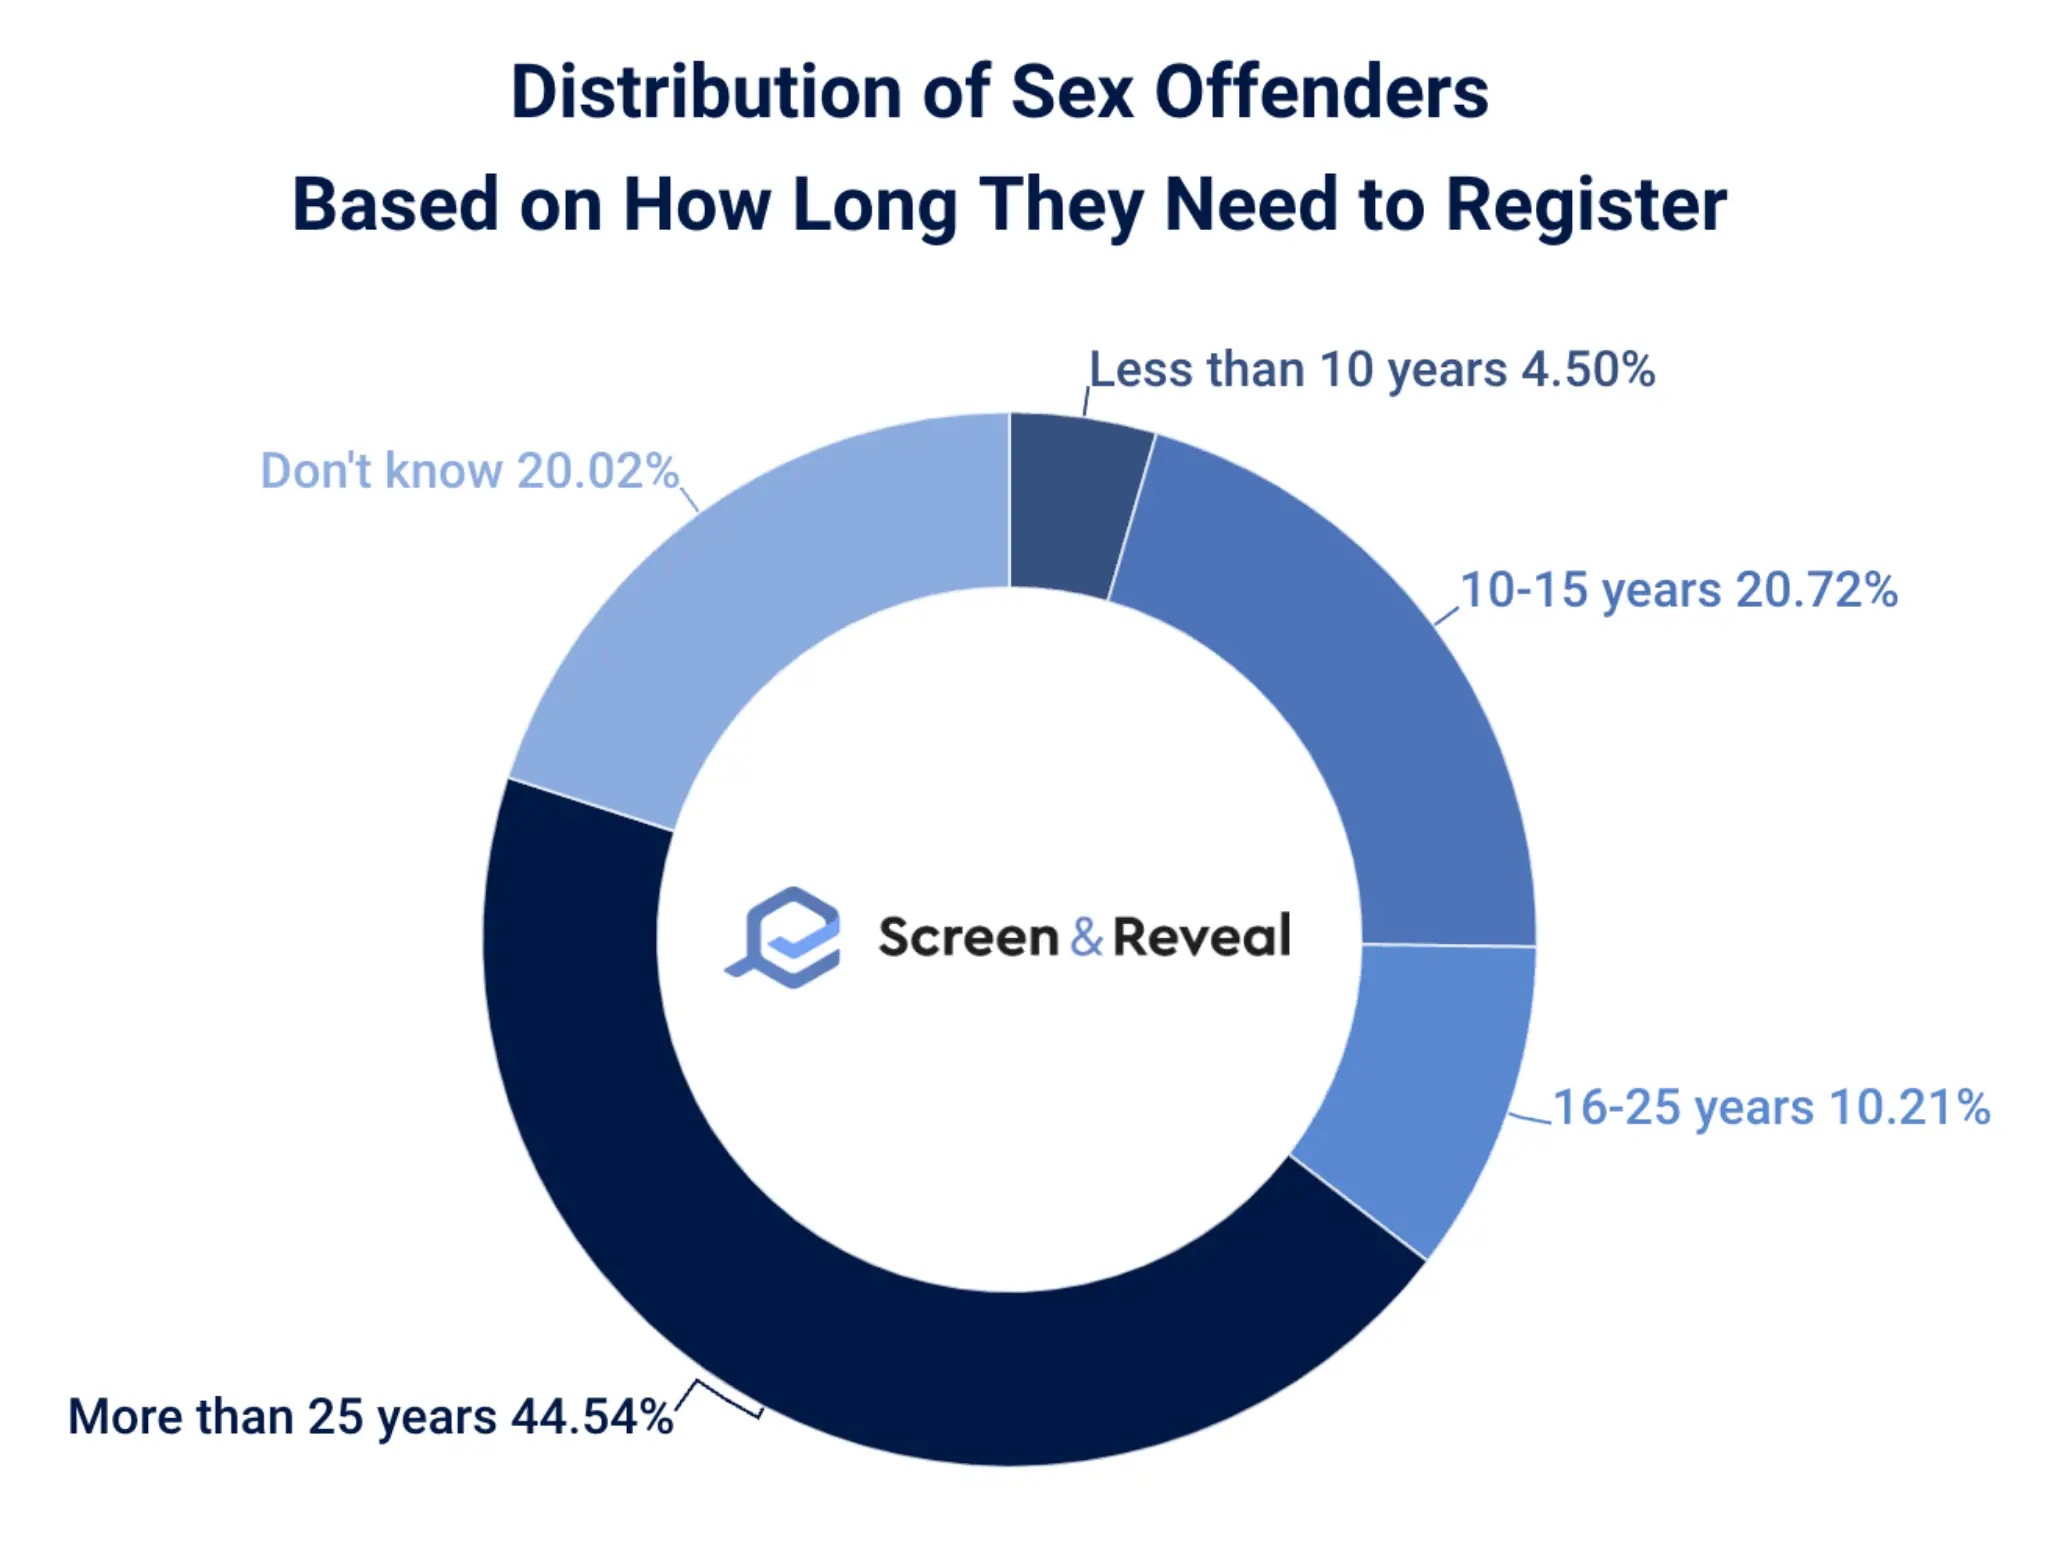
- 44.5% of those on the sex offender registry are required to register for more than 25 years.
- Juvenile sex offenders account for 25.8% of all sexual offenders.
- 56.3% of adult registered sex offenders have lost a job due to being on the registry.
- 50% of perpetrators of sexual violence are over 30 years old.
- 96% of adults on the US sex offender registry identify as male.
- The average recidivism rate for treated sex offenders is estimated at 27.9% and 39.2% for their untreated counterparts.
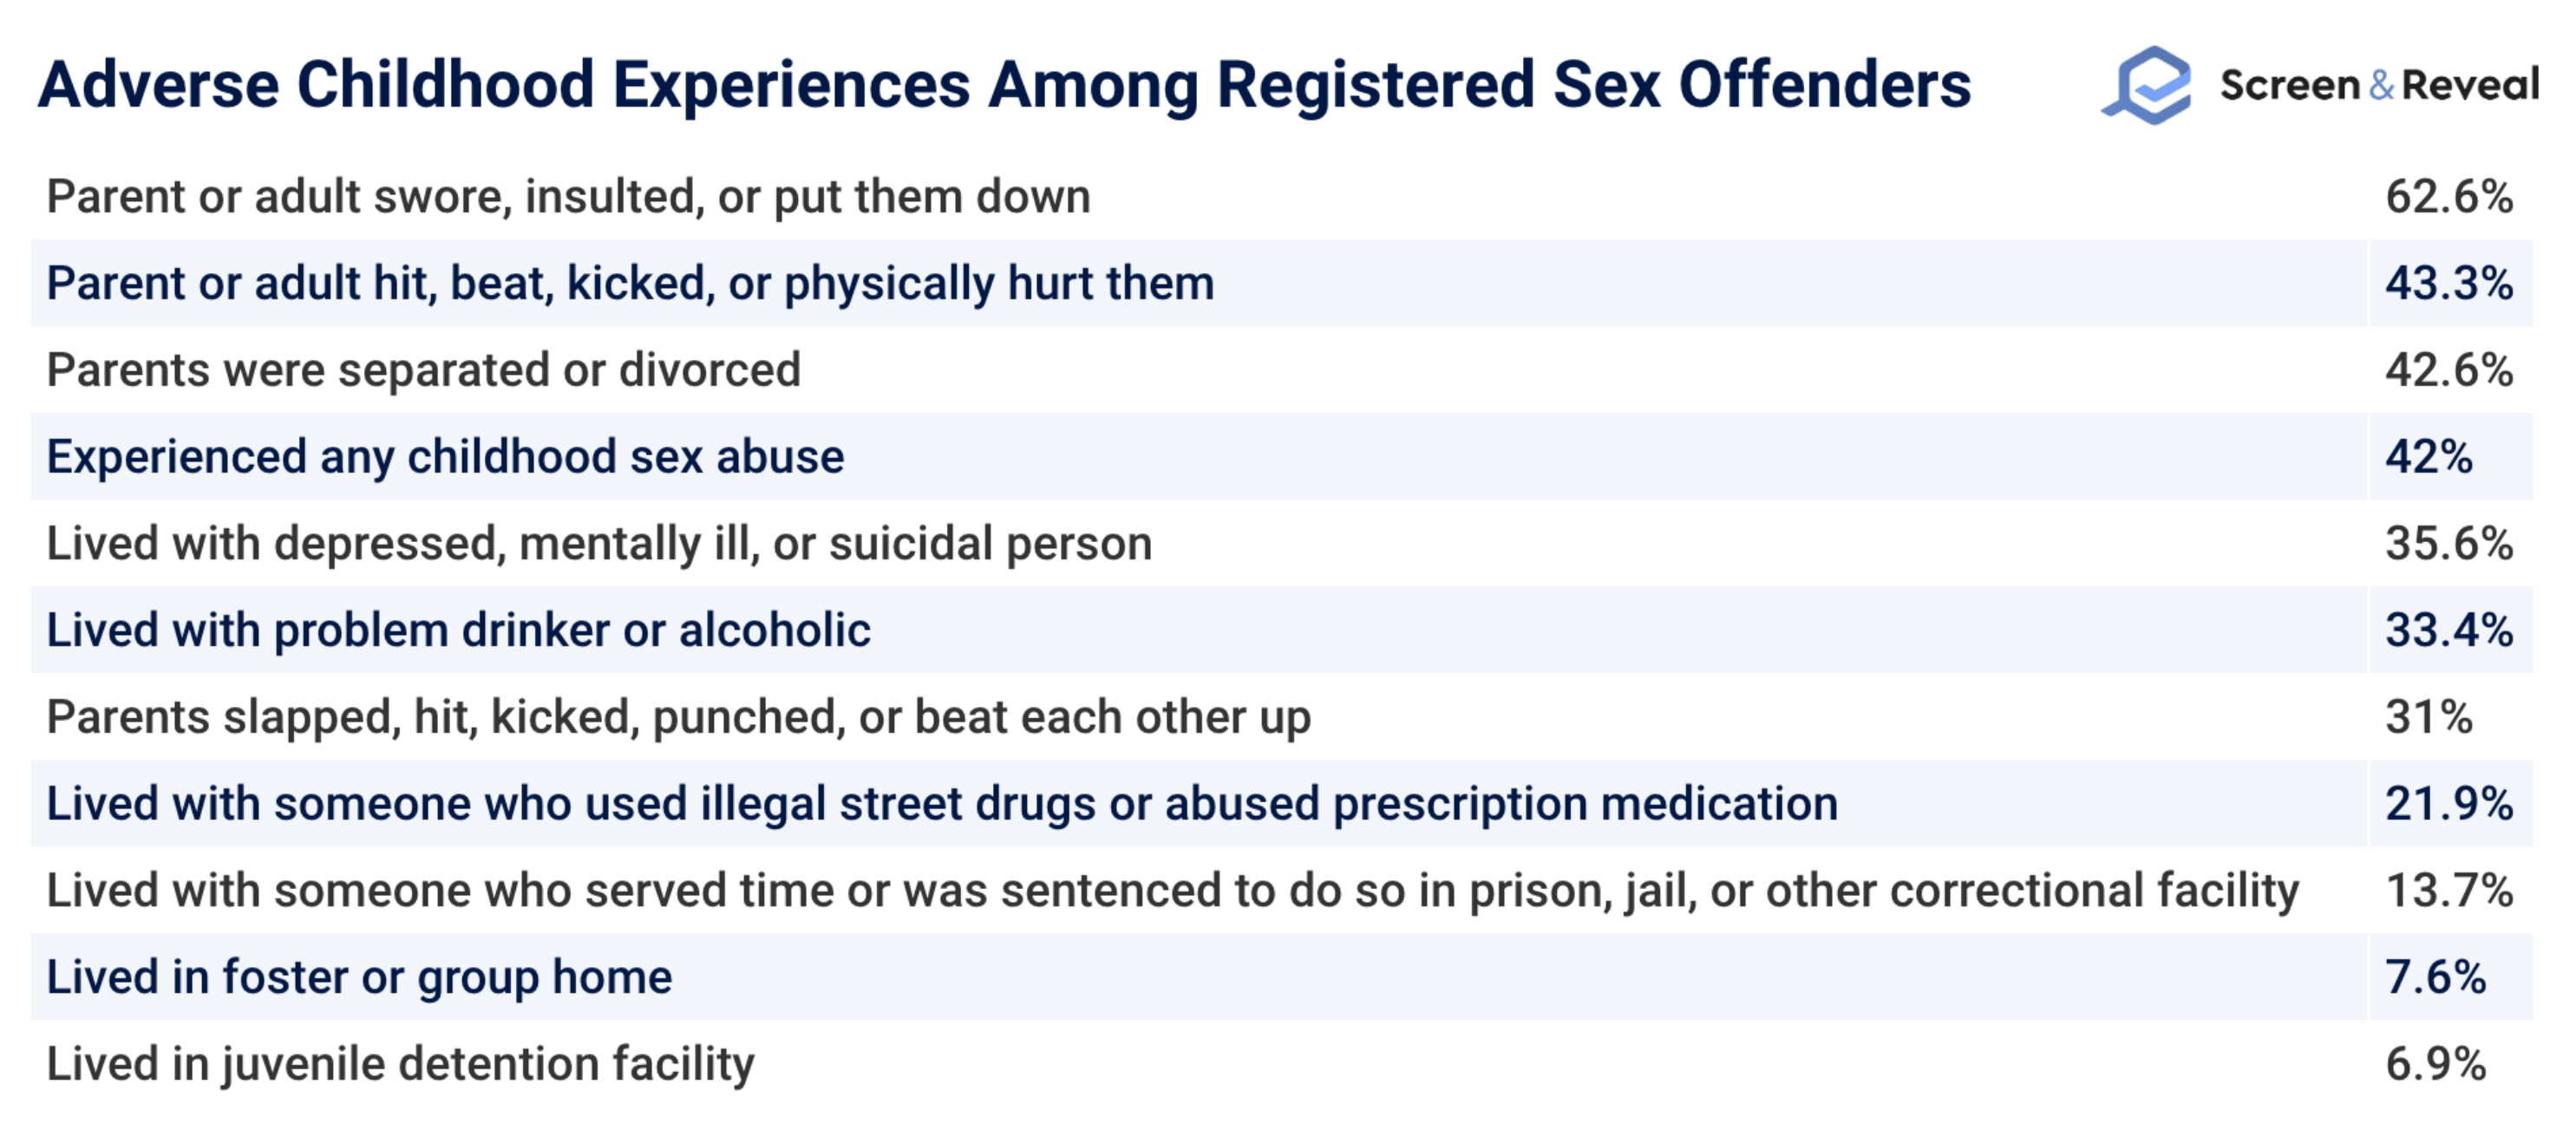
- 42% of sex offenders have experienced sexual abuse in their childhood.
How many sex offenders are there in the US?
As of February 2023, there are over 786,000 people on the US sex offenders registry.
This figure marks a 3% YoY increase and is the highest recorded since 2019. It also translates into 237 sex offenders per 100,000 residents.
Which state has the most sex offenders?
With over 100,000 registered, Texas is the state with the highest number of sex offenders.
However, when observing data on the number of sex offenders per 100,000 residents, Oregon takes the lead, with 772.
Sex Offender Statistics by State
| State | Registered Sex Offenders per 100,000 Residents | Number of Registered Sex Offenders |
| Alabama | 220 | 11,157 |
| Alaska | 454 | 3,331 |
| Arizona | 131 | 9,659 |
| Arkansas | 606 | 18,456 |
| California | 158 | 61,764 |
| Colorado | 211 | 12,323 |
| Connecticut | 164 | 5,929 |
| DC | 141 | 1,014 |
| Delaware | 418 | 4,253 |
| Florida | 144 | 32,136 |
| Georgia | 223 | 24,334 |
| Hawaii | 212 | 3,055 |
| Idaho | 265 | 5,141 |
| Illinois | 264 | 33,269 |
| Indiana | 194 | 13,258 |
| Iowa | 204 | 6,545 |
| Kansas | 392 | 11,511 |
| Kentucky | 207 | 9,362 |
| Louisiana | 287 | 13,196 |
| Maine | 207 | 2,864 |
| Maryland | 106 | 6,560 |
| Massachusetts | 81 | 5,665 |
| Michigan | 400 | 40,176 |
| Minnesota | 321 | 18,328 |
| Mississippi | 284 | 8,343 |
| Missouri | 377 | 23,291 |
| Montana | 267 | 2,953 |
| Nebraska | 271 | 5,333 |
| Nevada | 234 | 7,445 |
| New Hampshire | 185 | 2,576 |
| New Jersey | 50 | 4,645 |
| New Mexico | 131 | 2,769 |
| New York | 218 | 42,871 |
| North Carolina | 259 | 27,684 |
| North Dakota | 257 | 2,005 |
| Ohio | 168 | 19,729 |
| Oklahoma | 195 | 7,856 |
| Oregon | 772 | 32,715 |
| Pennsylvania | 198 | 25,639 |
| Rhode Island | 129 | 1,416 |
| South Carolina | 396 | 20,923 |
| South Dakota | 448 | 4,080 |
| Tennessee | 314 | 22,168 |
| Texas | 336 | 100,989 |
| Utah | 283 | 9,580 |
| Vermont | 194 | 1,256 |
| Virginia | 175 | 15,162 |
| Washington | 90 | 6,986 |
| West Virginia | 354 | 6,288 |
| Wisconsin | 447 | 26,353 |
| Wyoming | 429 | 2,497 |
Registered Sex Offender Statistics
- 14.9% of adults on the sex offender registry were convicted prior to their sex offense conviction.
- Among adult registered sex offenders, 10.9% have two or more sexual offense convictions.
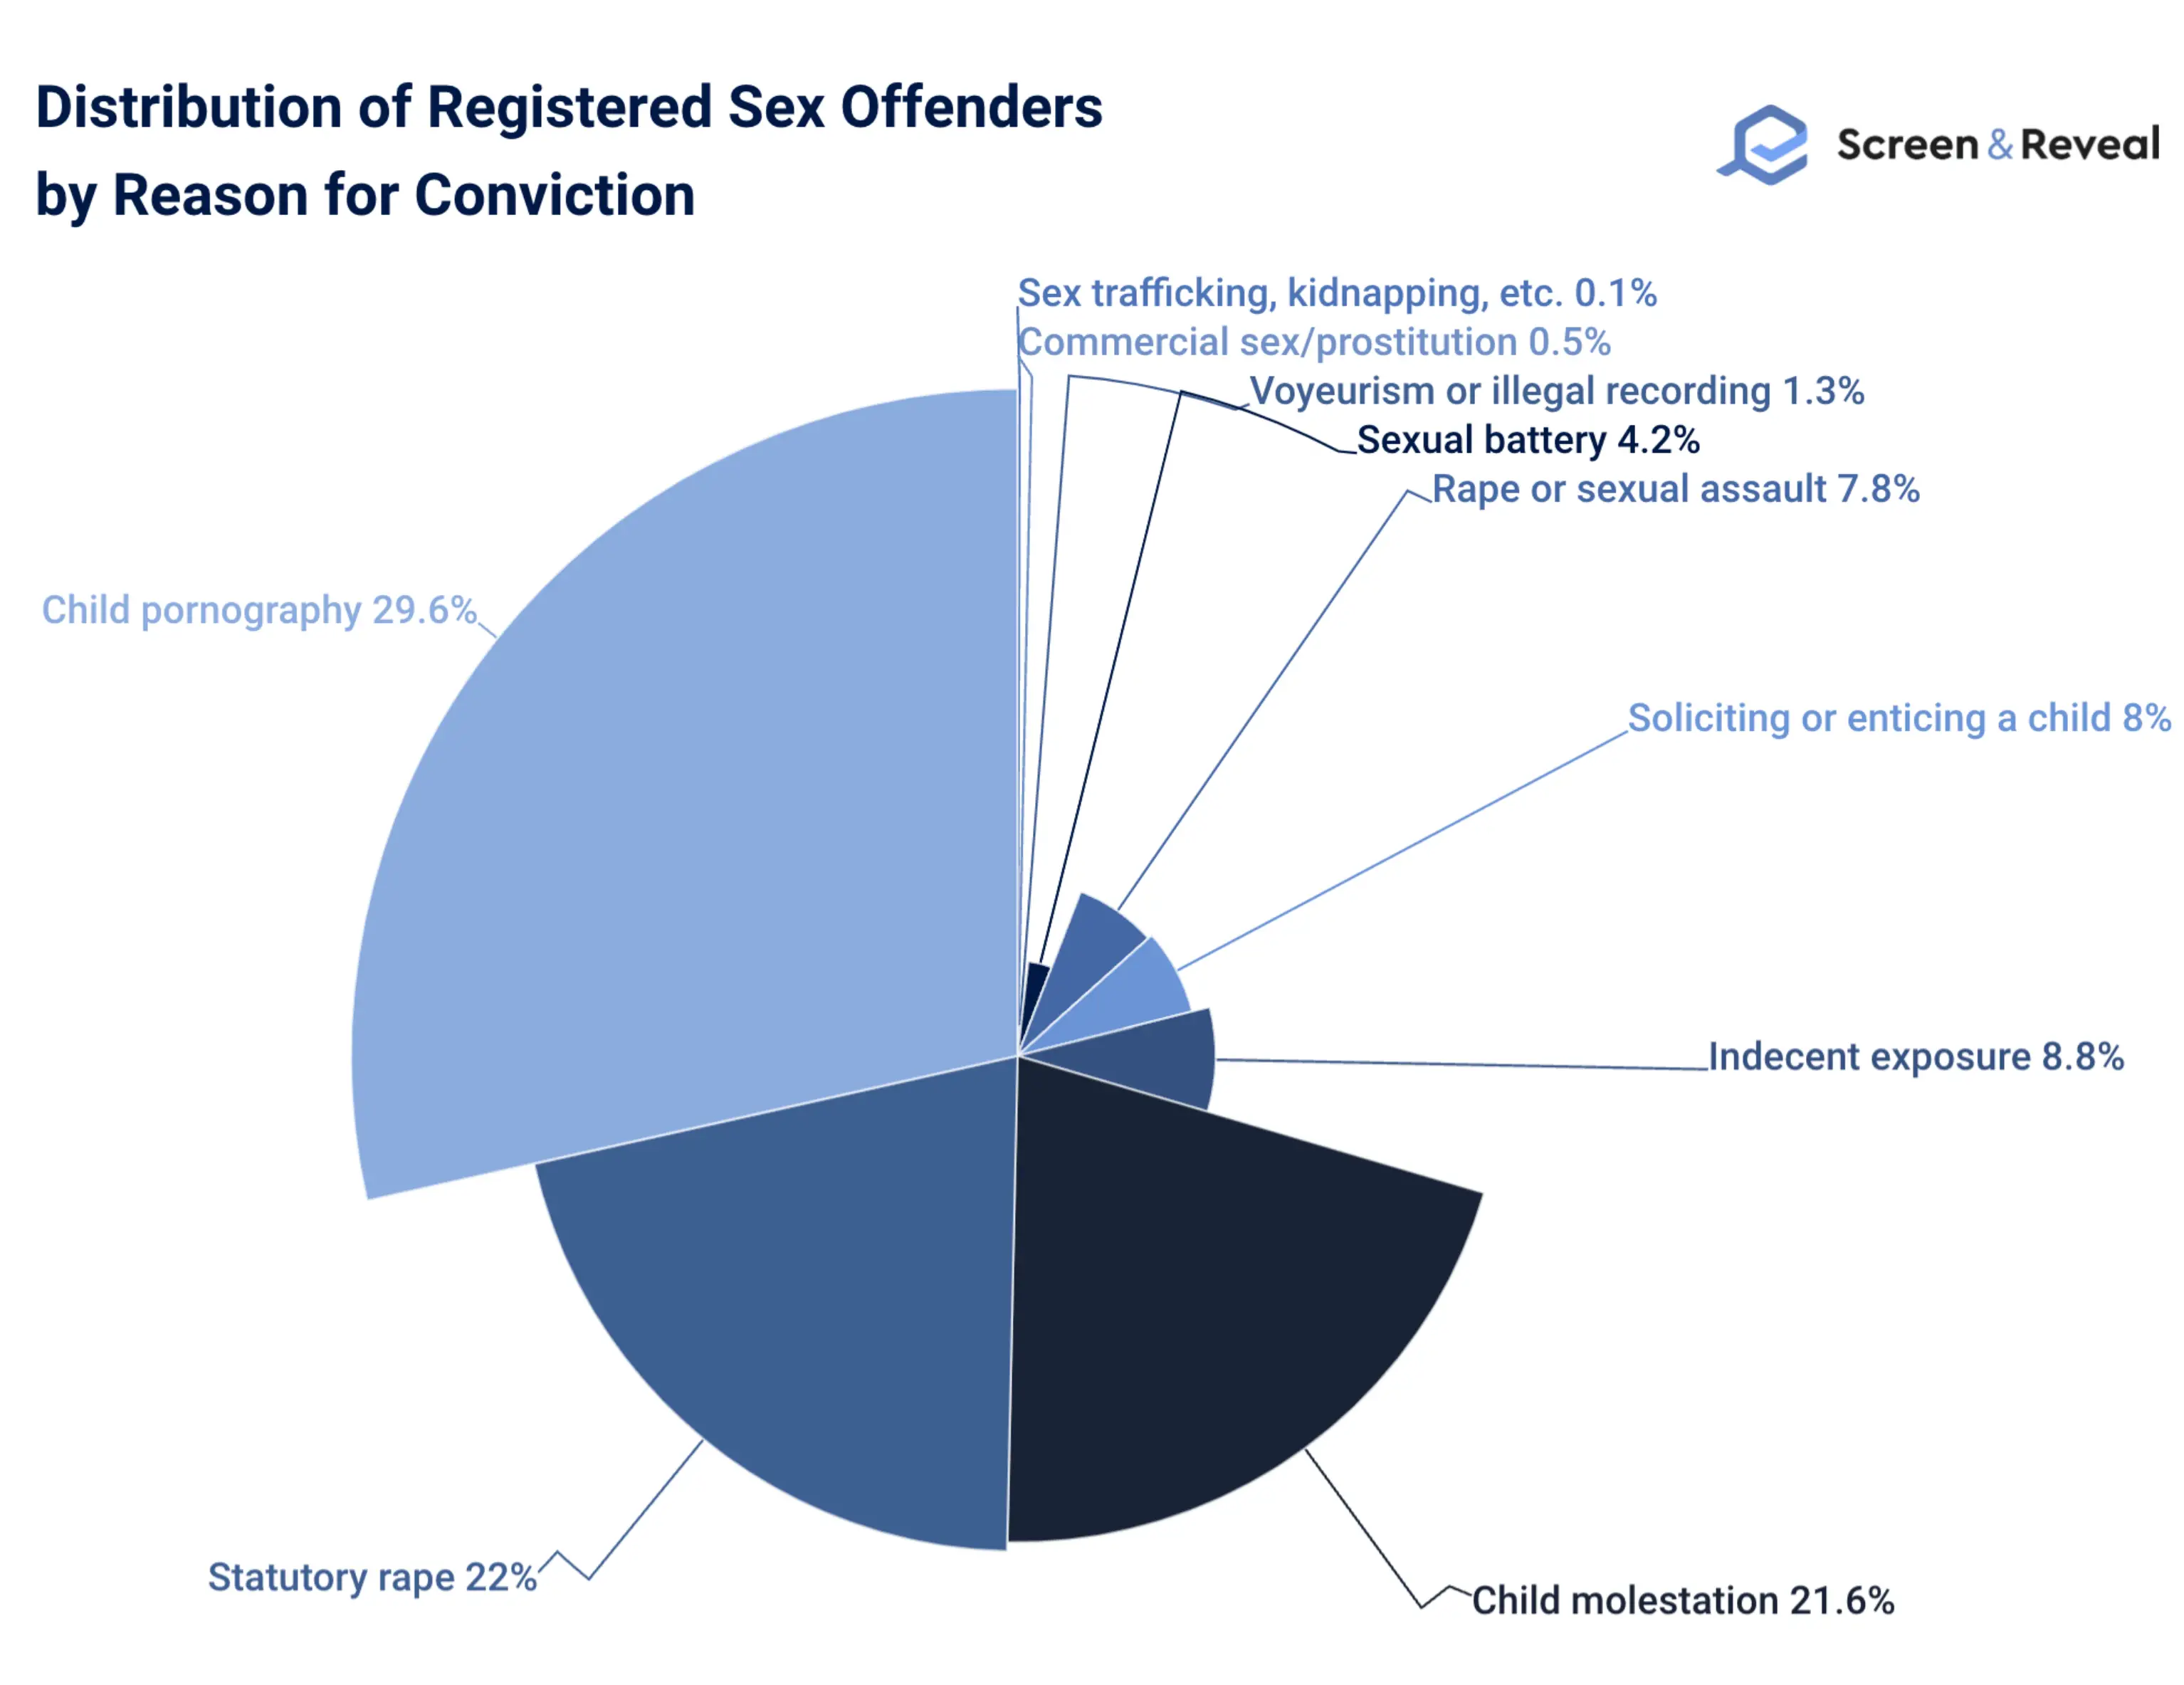
- At 29.6%, distributing, manufacturing, or possessing is the most common reason for conviction among registered sex offenders.
- In 36.1% of cases, the victim/s of adult registered sex offenders are family members.
- 75.6% of victims of registered sex offenders are female. 28.4% are male, and 0.2% are transgender.
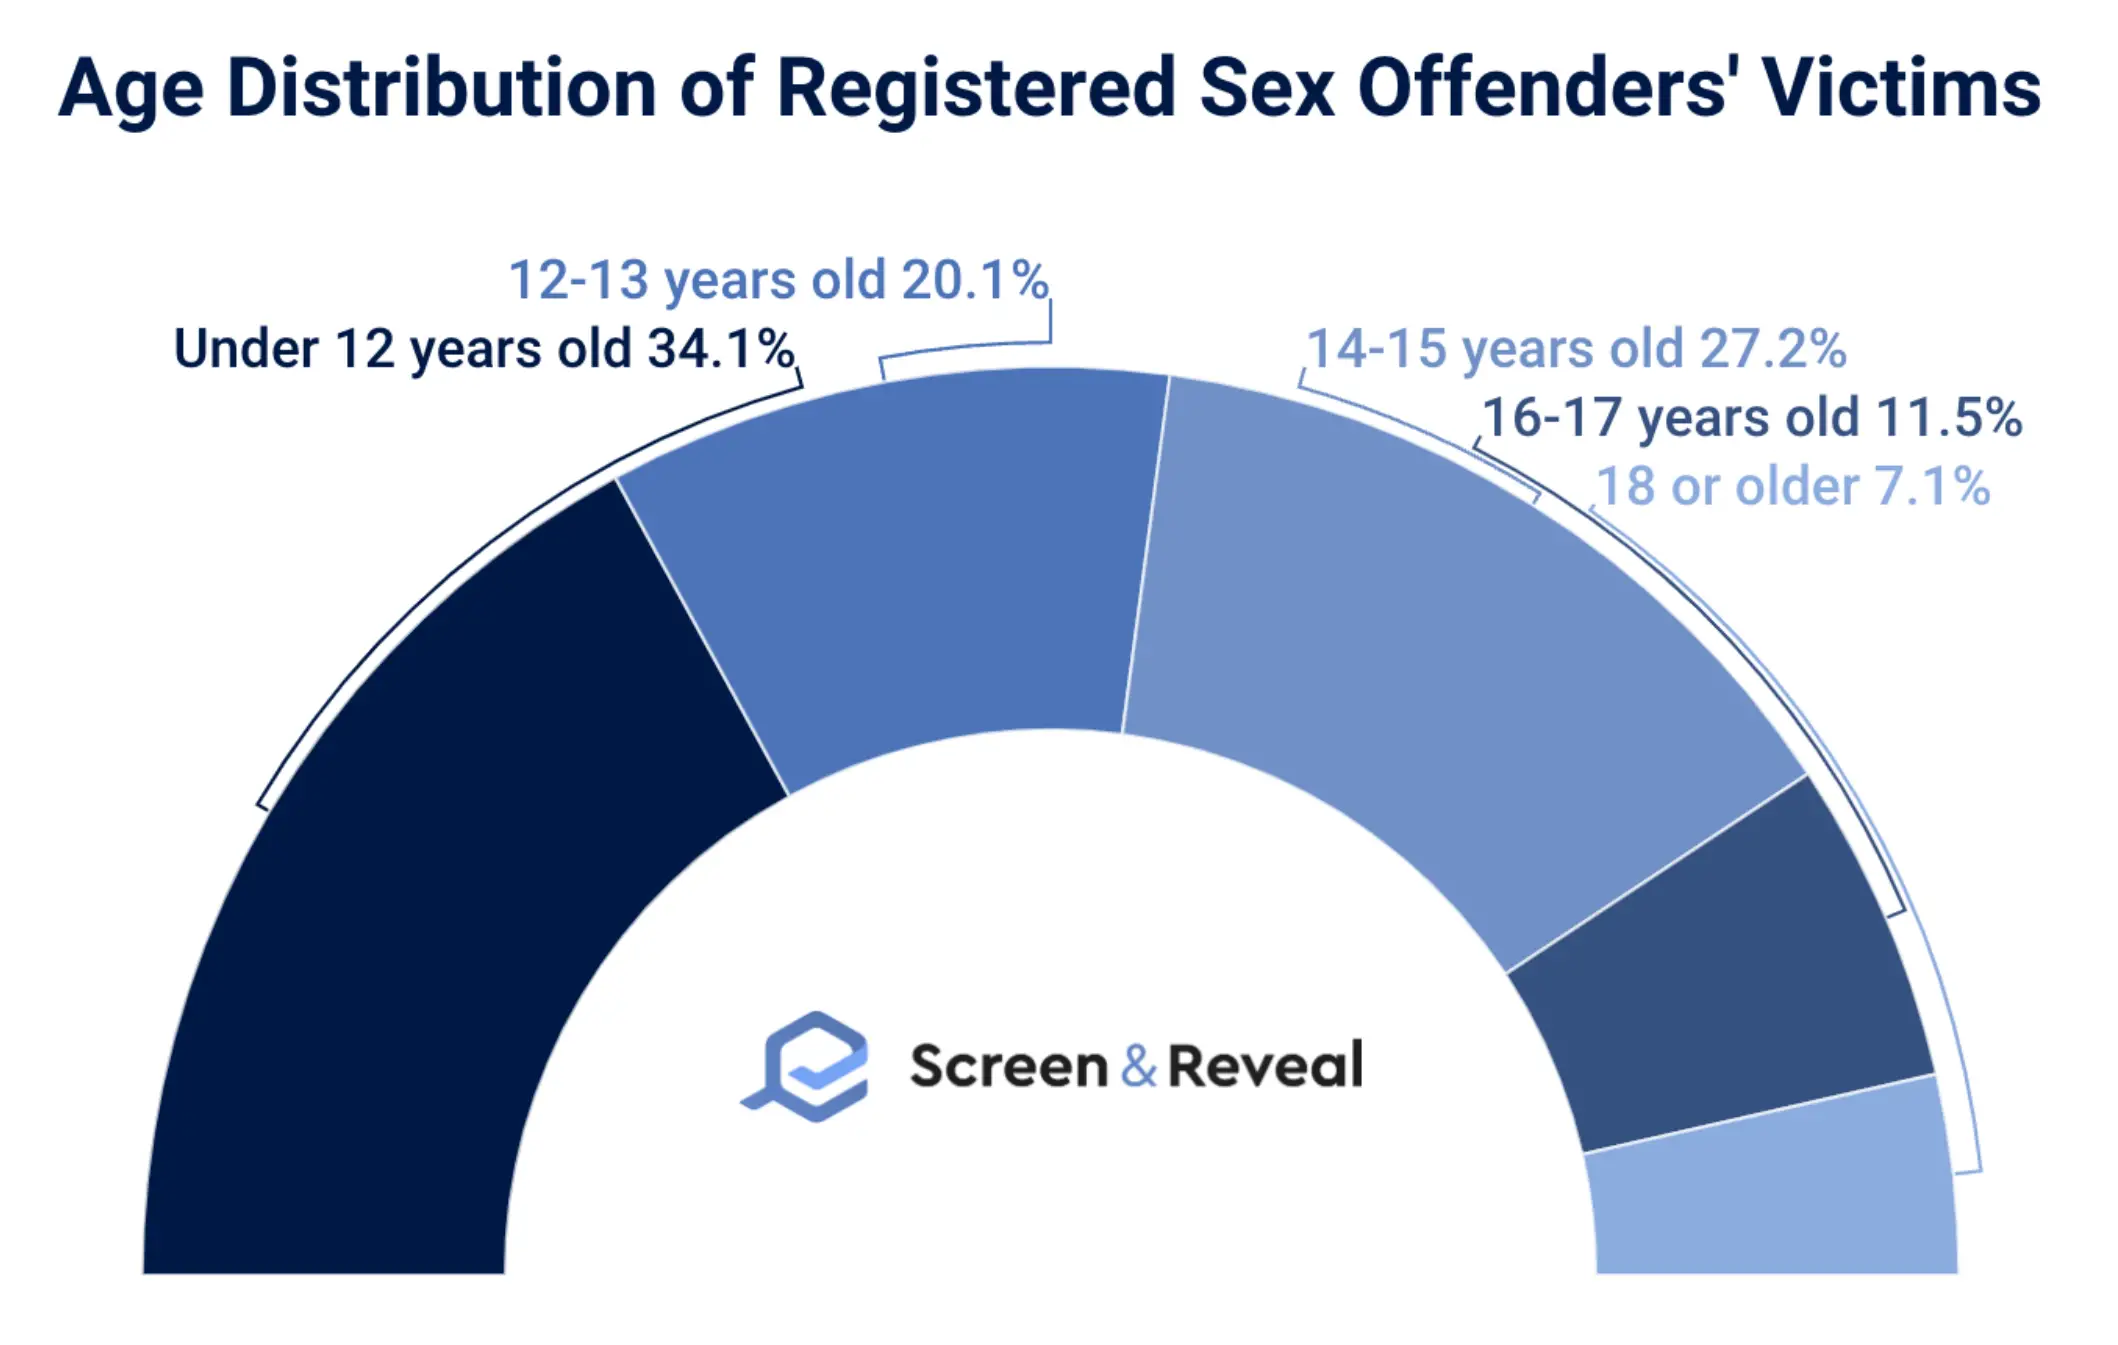
- Registered sex offender statistics reveal that 34.1% of victims of registered sex offenders are under 12 years old.
- 66.9% of registered sex offenders pleaded guilty, and 23.8% pleaded no contest. 9.3% went to trial, and 37.6% were convicted of a reduced sentence.
- 68.4% of registered sex offenders had privately obtained defense attorneys, the rest had them court-assigned. Still, 64.1% of registered sex offenders are dissatisfied with their defense to a different extent.
- Incarceration statistics reveal that 55.4% of registered sex offenders went to prison. 20.1% went to jail only, while 24.5% didn’t go to prison or jail.
- The majority, or 49.6%, have been in prison or jail for two to nine years. The second-largest portion, or 31.7%, for less than a year. 16.3% of registered sex offenders have been in prison or jail between 10 and 25 years, while 2.4% for over 25 years.
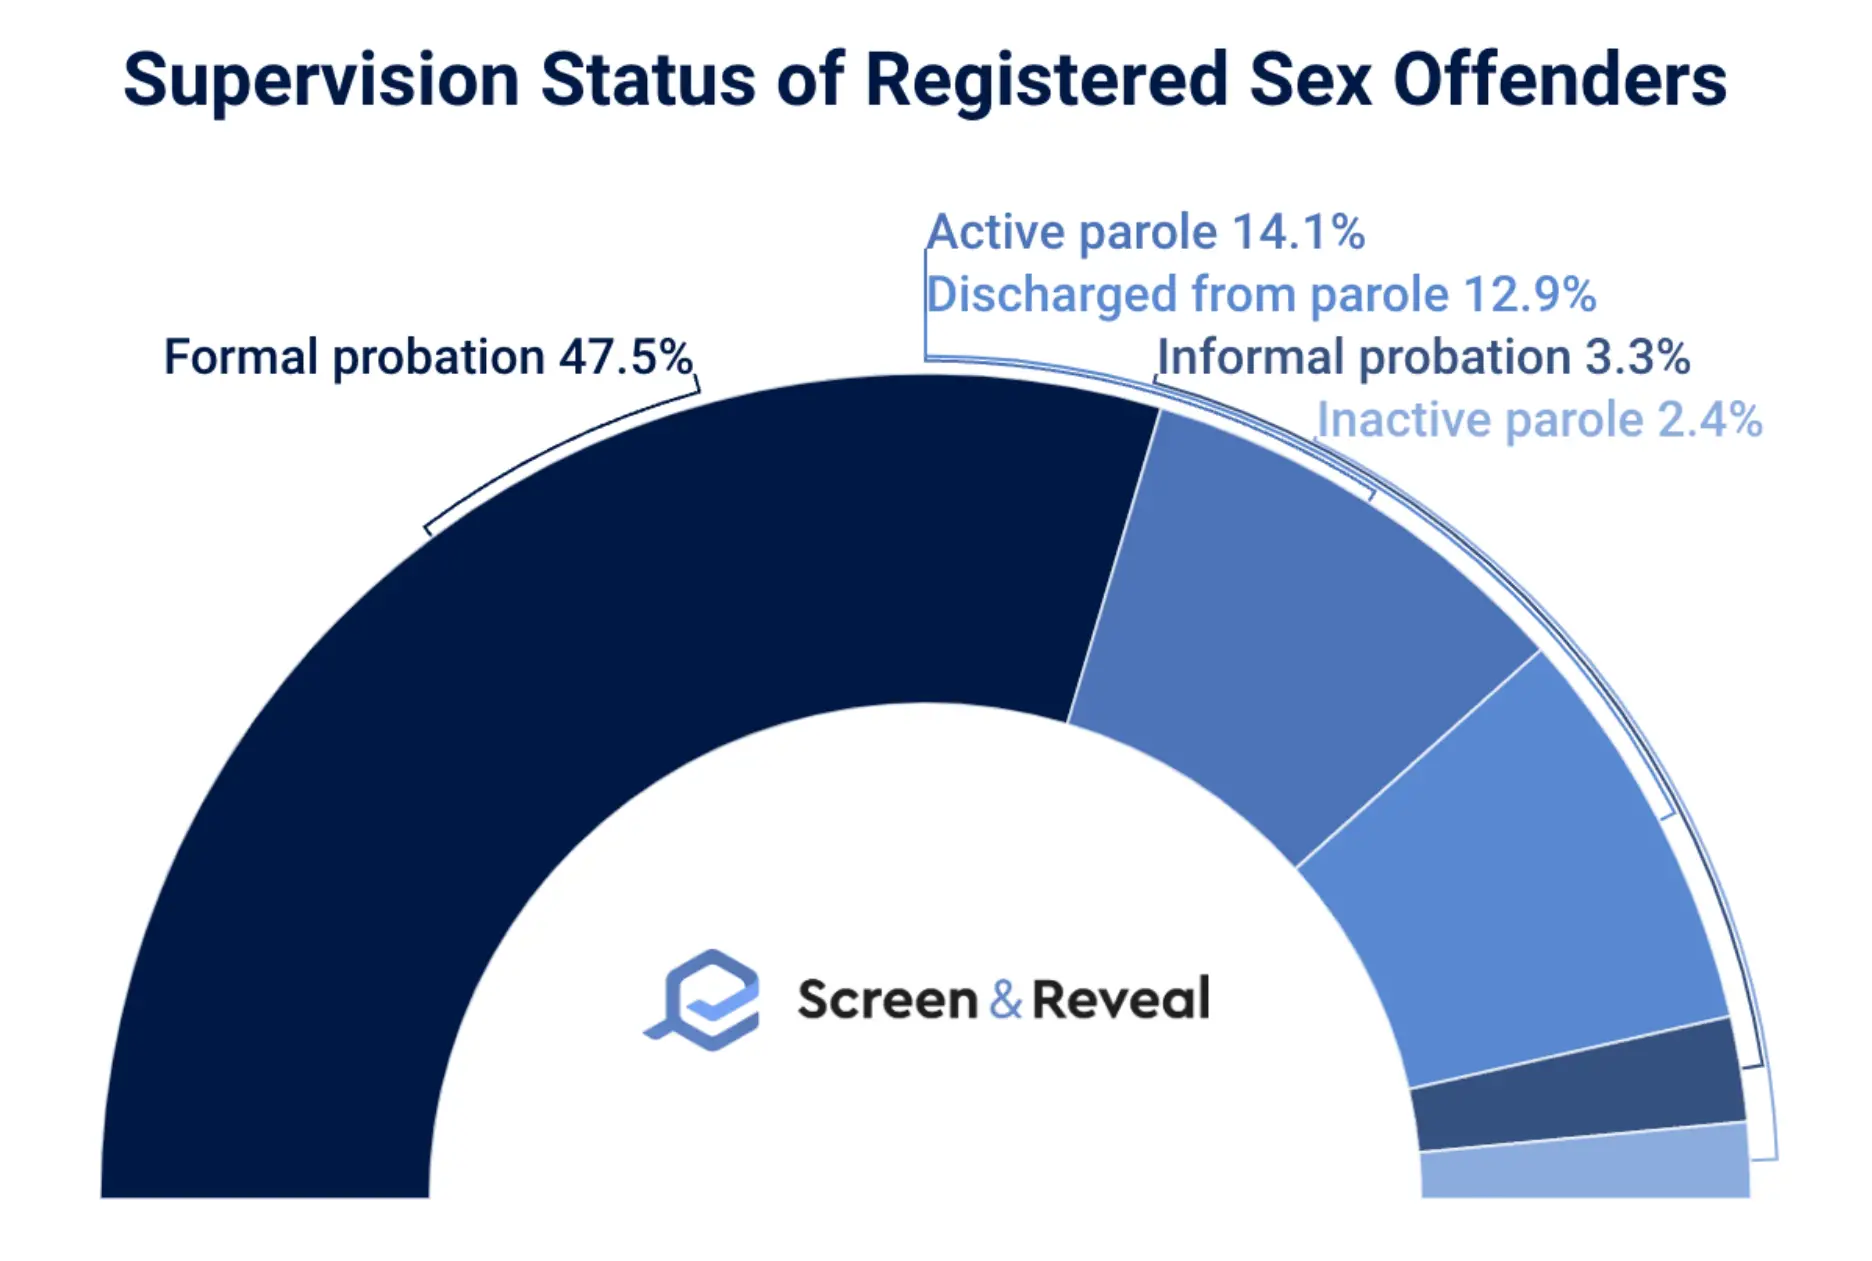
- 91.3% of registered sex offenders have been assigned probation/parole.
Sex Offender Registry Statistics
- 62.8% of sex offenders are told how long they will stay on the registry.
- The majority, or 44.5%, of offenders on the sex offender registry are required to register for more than 25 years.
- These requirements haven’t changed for 66.3% of sex offenders since their registration. Only 6.7% have had their time decreased, while 27% have had it increased.
- Sex offender registry statistics reveal that 7.6% of those on the sex offender registry have managed to be removed from it.
- 71.3% of sex offenders are registered in a single state. 21.8% are registered in one additional state, while 7% in two or more.
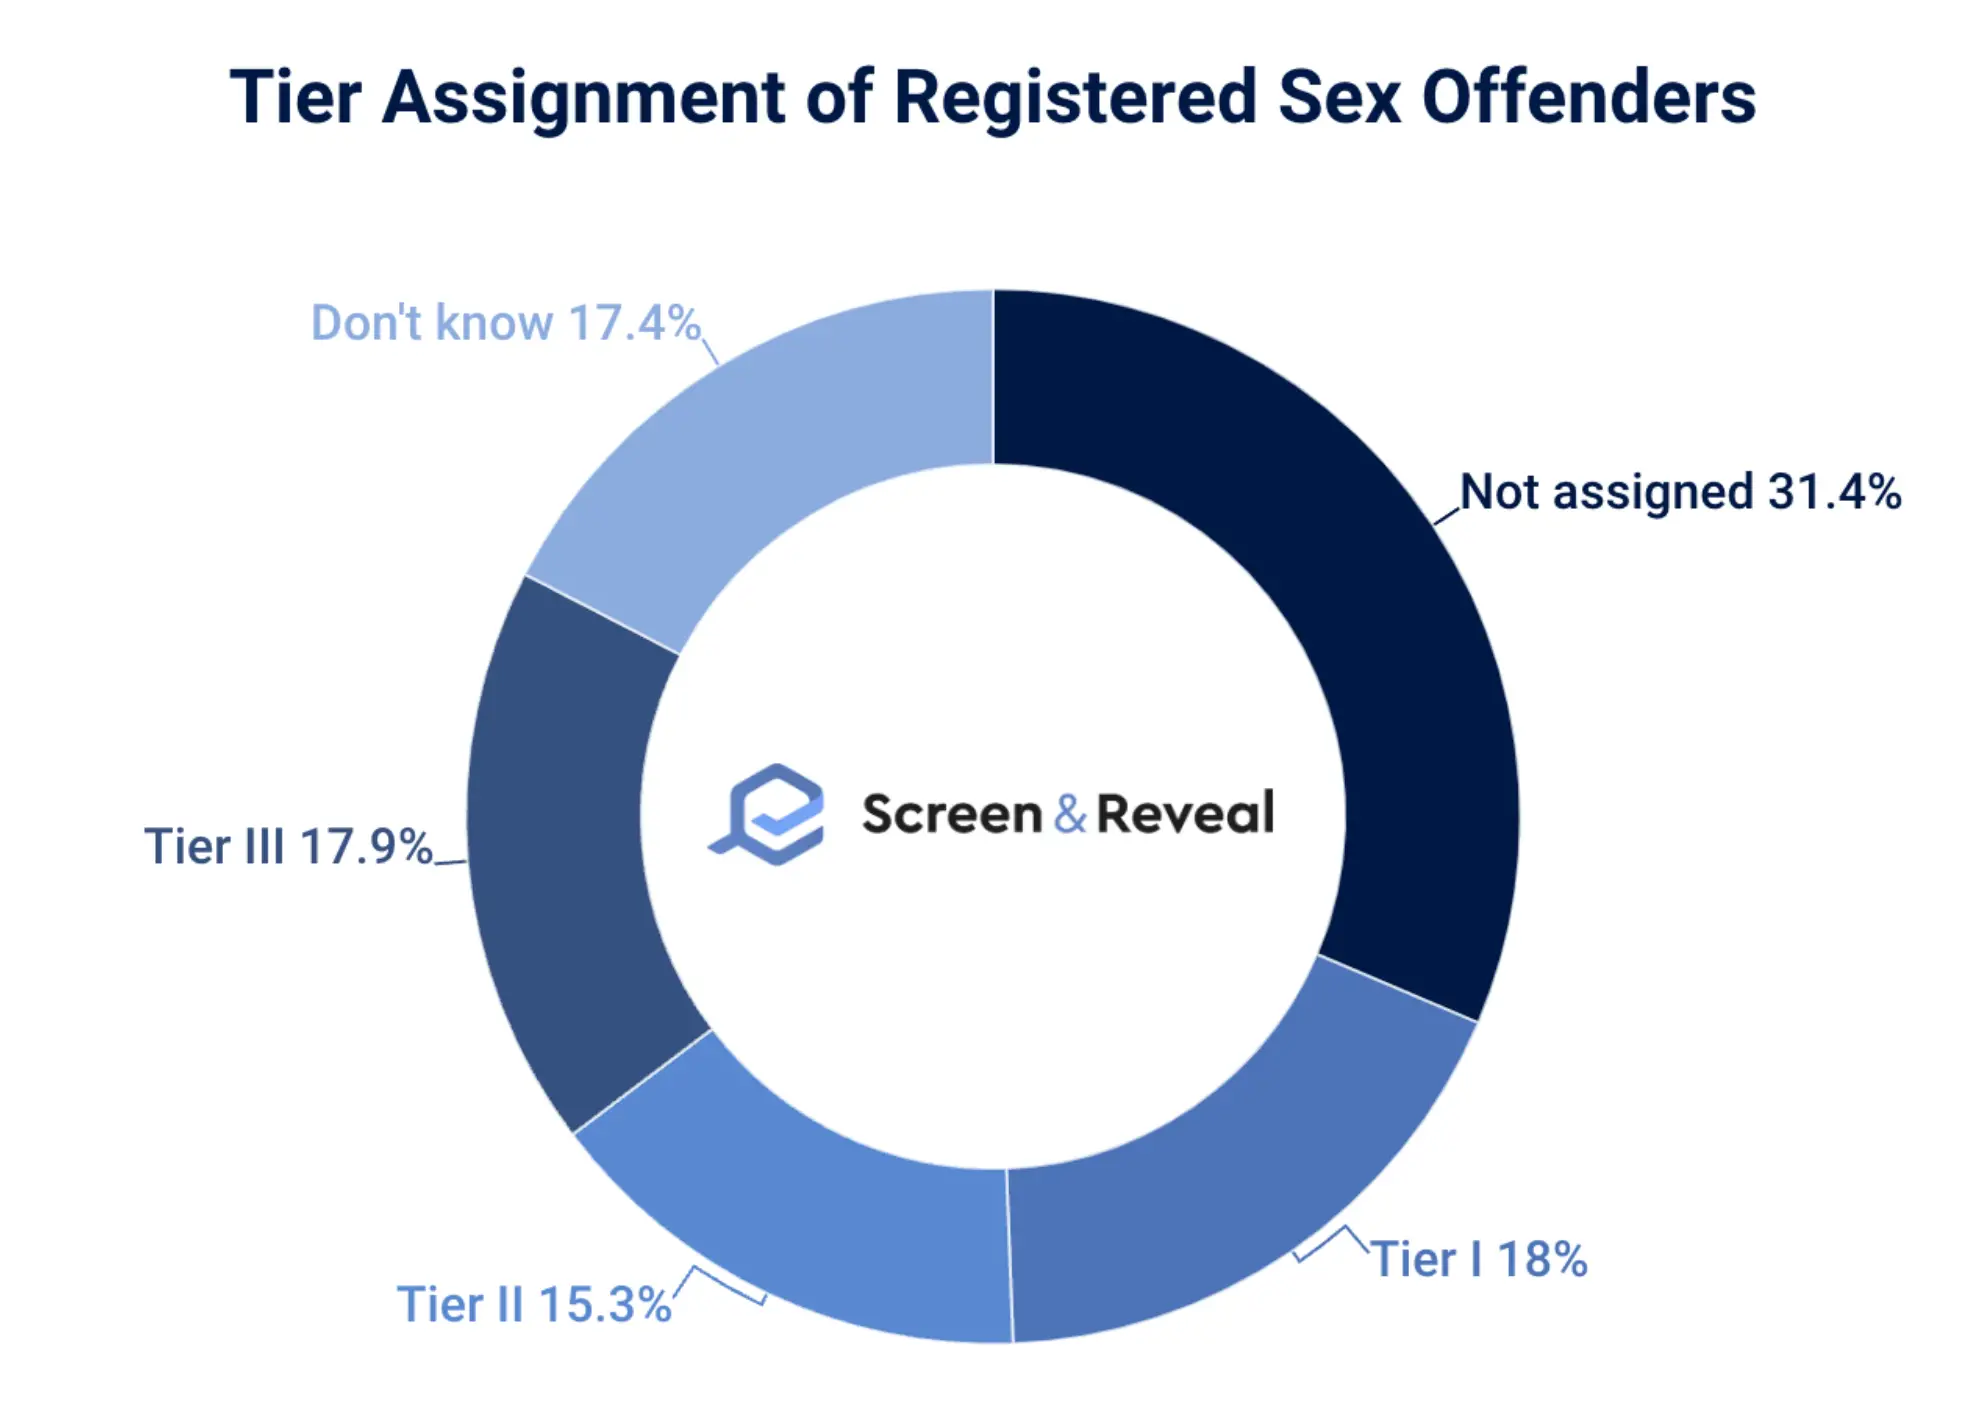
- The majority, or 31.4%, of those on the sex offender registry haven’t been assigned a tier.
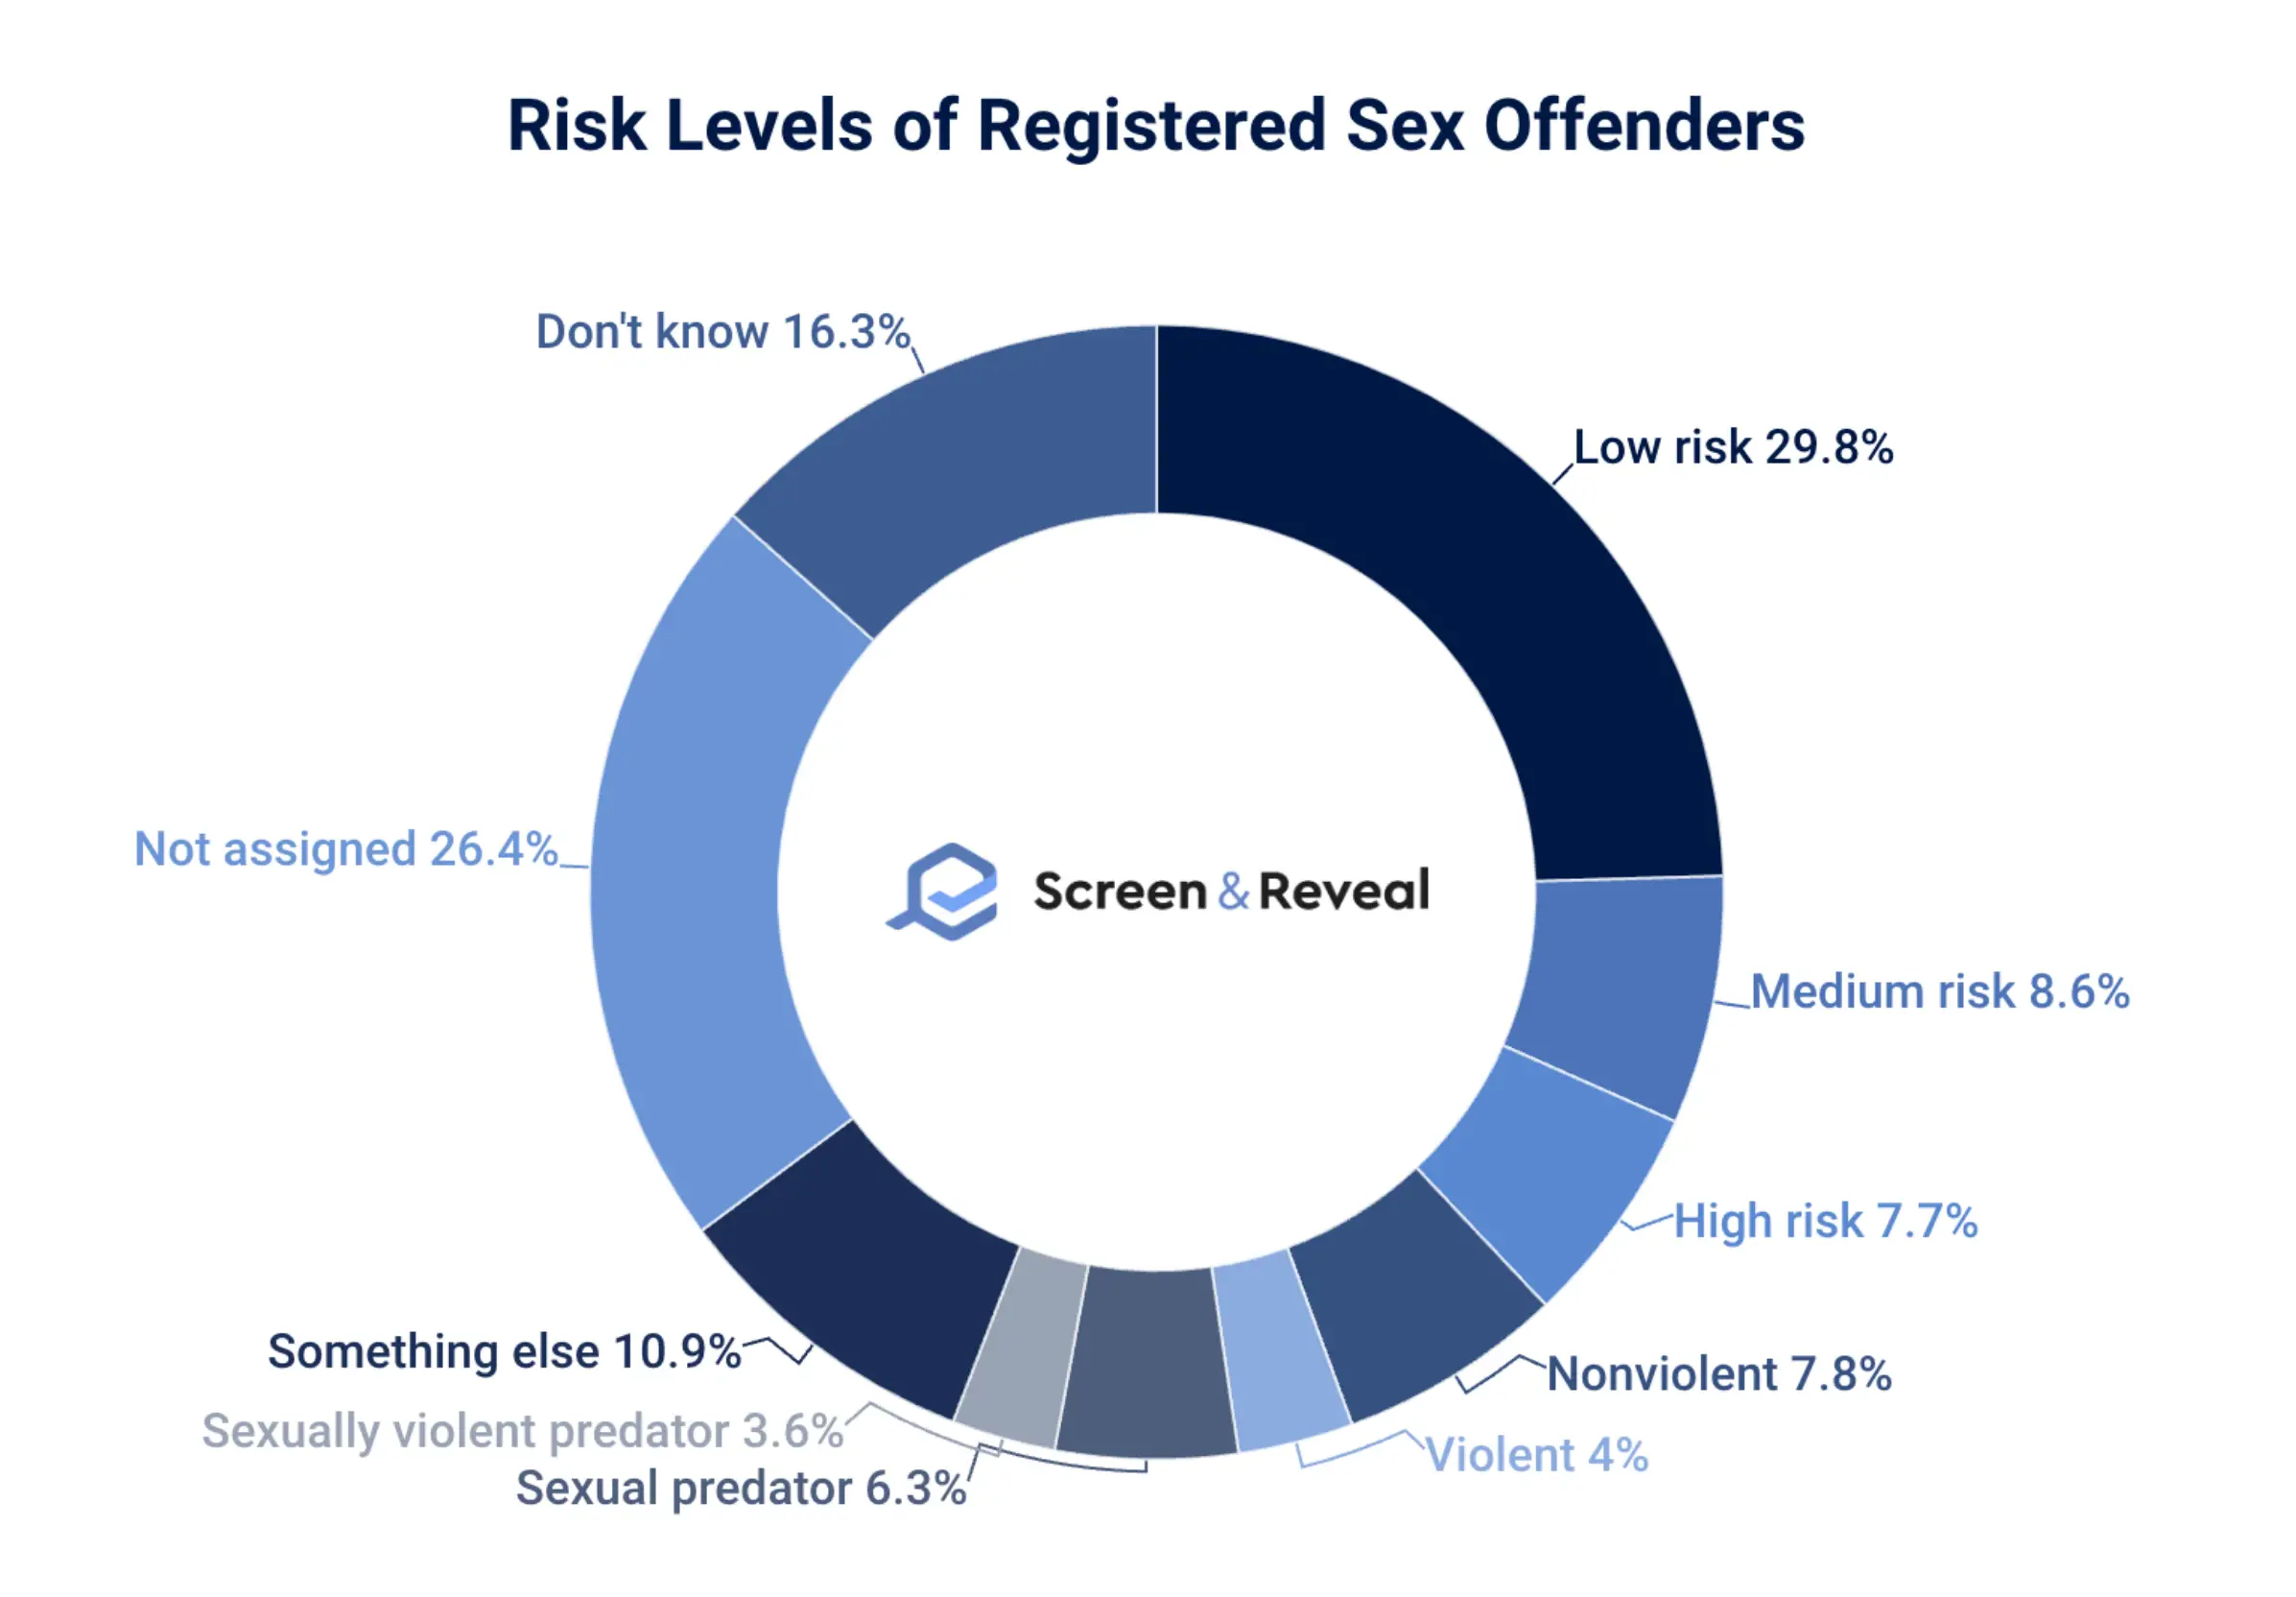
- The majority, or 29.8%, of those on the sex offender registry are considered low risk on a scale that differentiates sexual offenders vs predators.
- The appointed tiers and/or risk levels haven’t changed for 60.7% of sex offenders since their registration. 12.5% have had them raised, while 5.5% lowered.
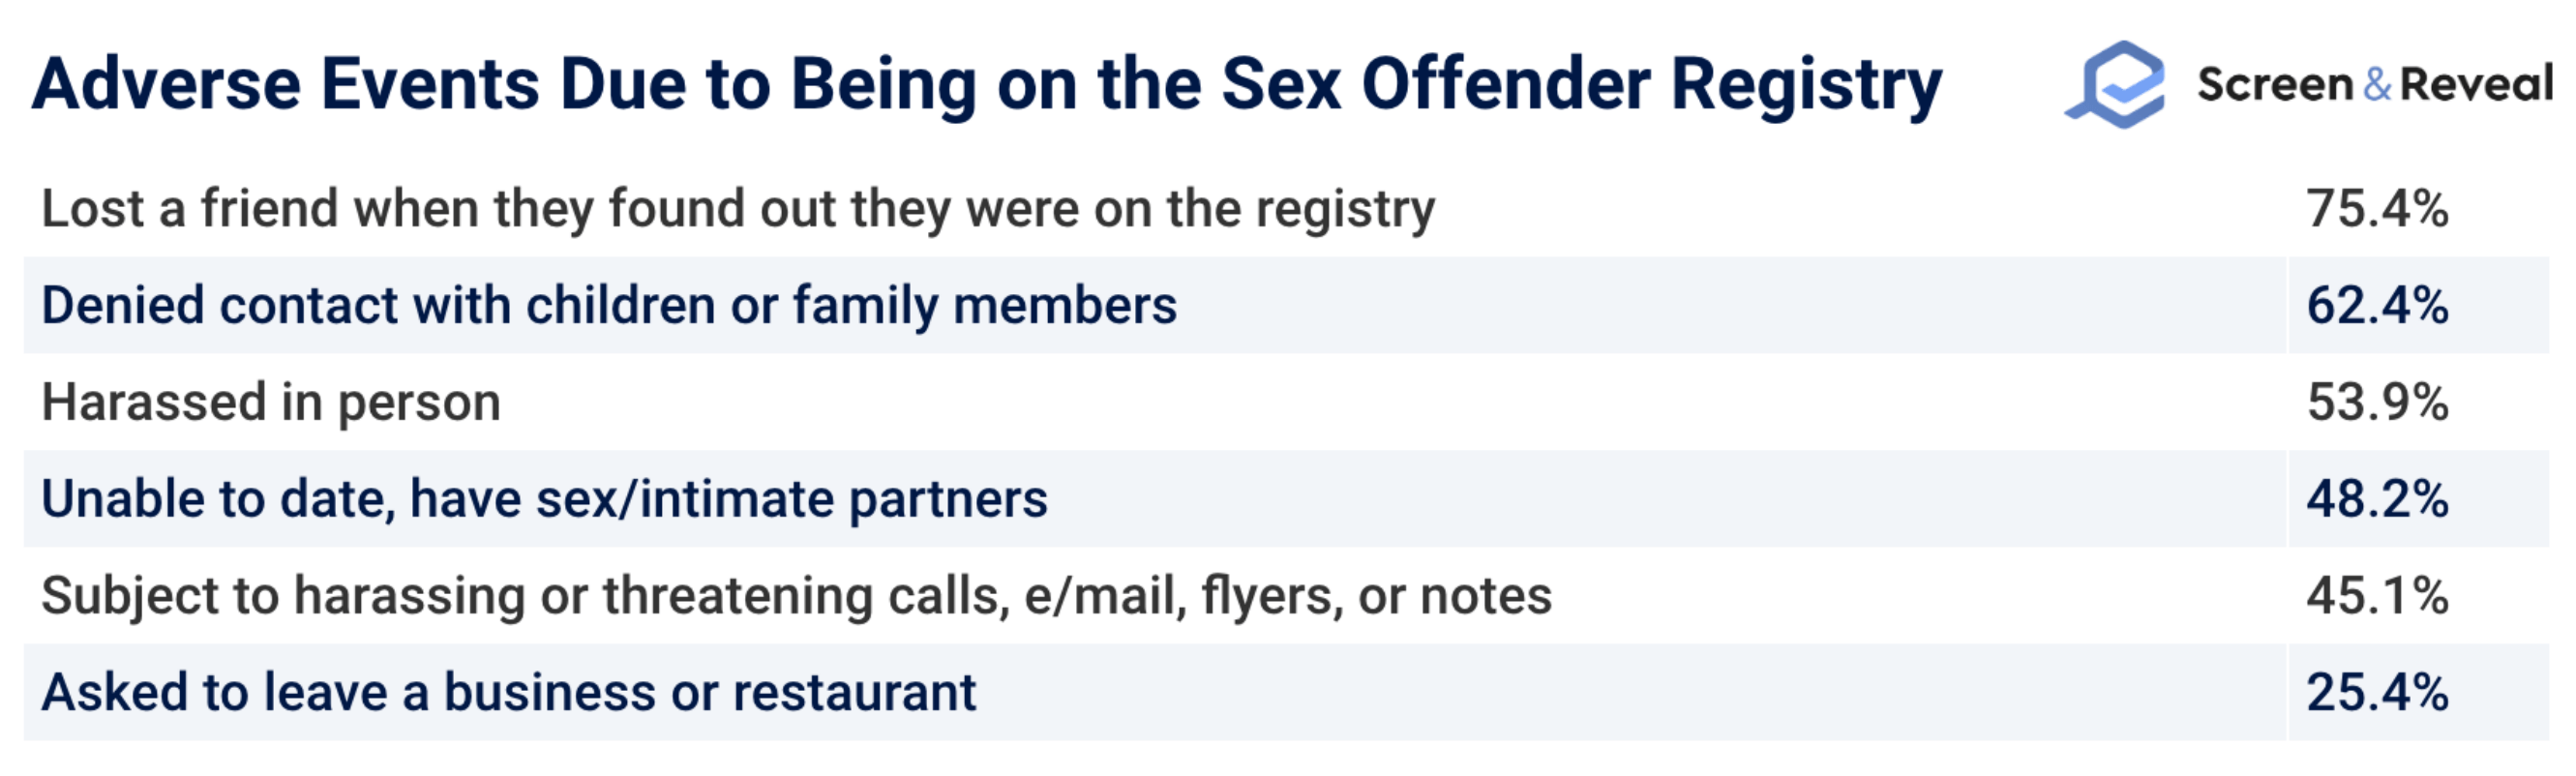
- 89.8% of sex offenders have been victims of violence and harassment due to being on the registry.
Juvenile Sex Offender Statistics
- Juvenile sex offenders account for 25.8% of all sexual offenders.
- 35.6% of sex offense perpetrators against juvenile victims are also juveniles.
- Juvenile sexual offenders account for only 3.1% of all juvenile offenders and 7.4% of all violent juvenile offenders.
- 96.2% of juvenile sexual offenders target other juveniles.
- 90.5% of juvenile sex offenders commit forcible sex offenses.
- 12.8% of juvenile sex offenders are involved in incidents with multiple victims.
Statistics on Sex Offenders – Juveniles Committing Sex Offenses Against Minors
- 93% of juvenile sex offenders who commit crimes against minors are male.
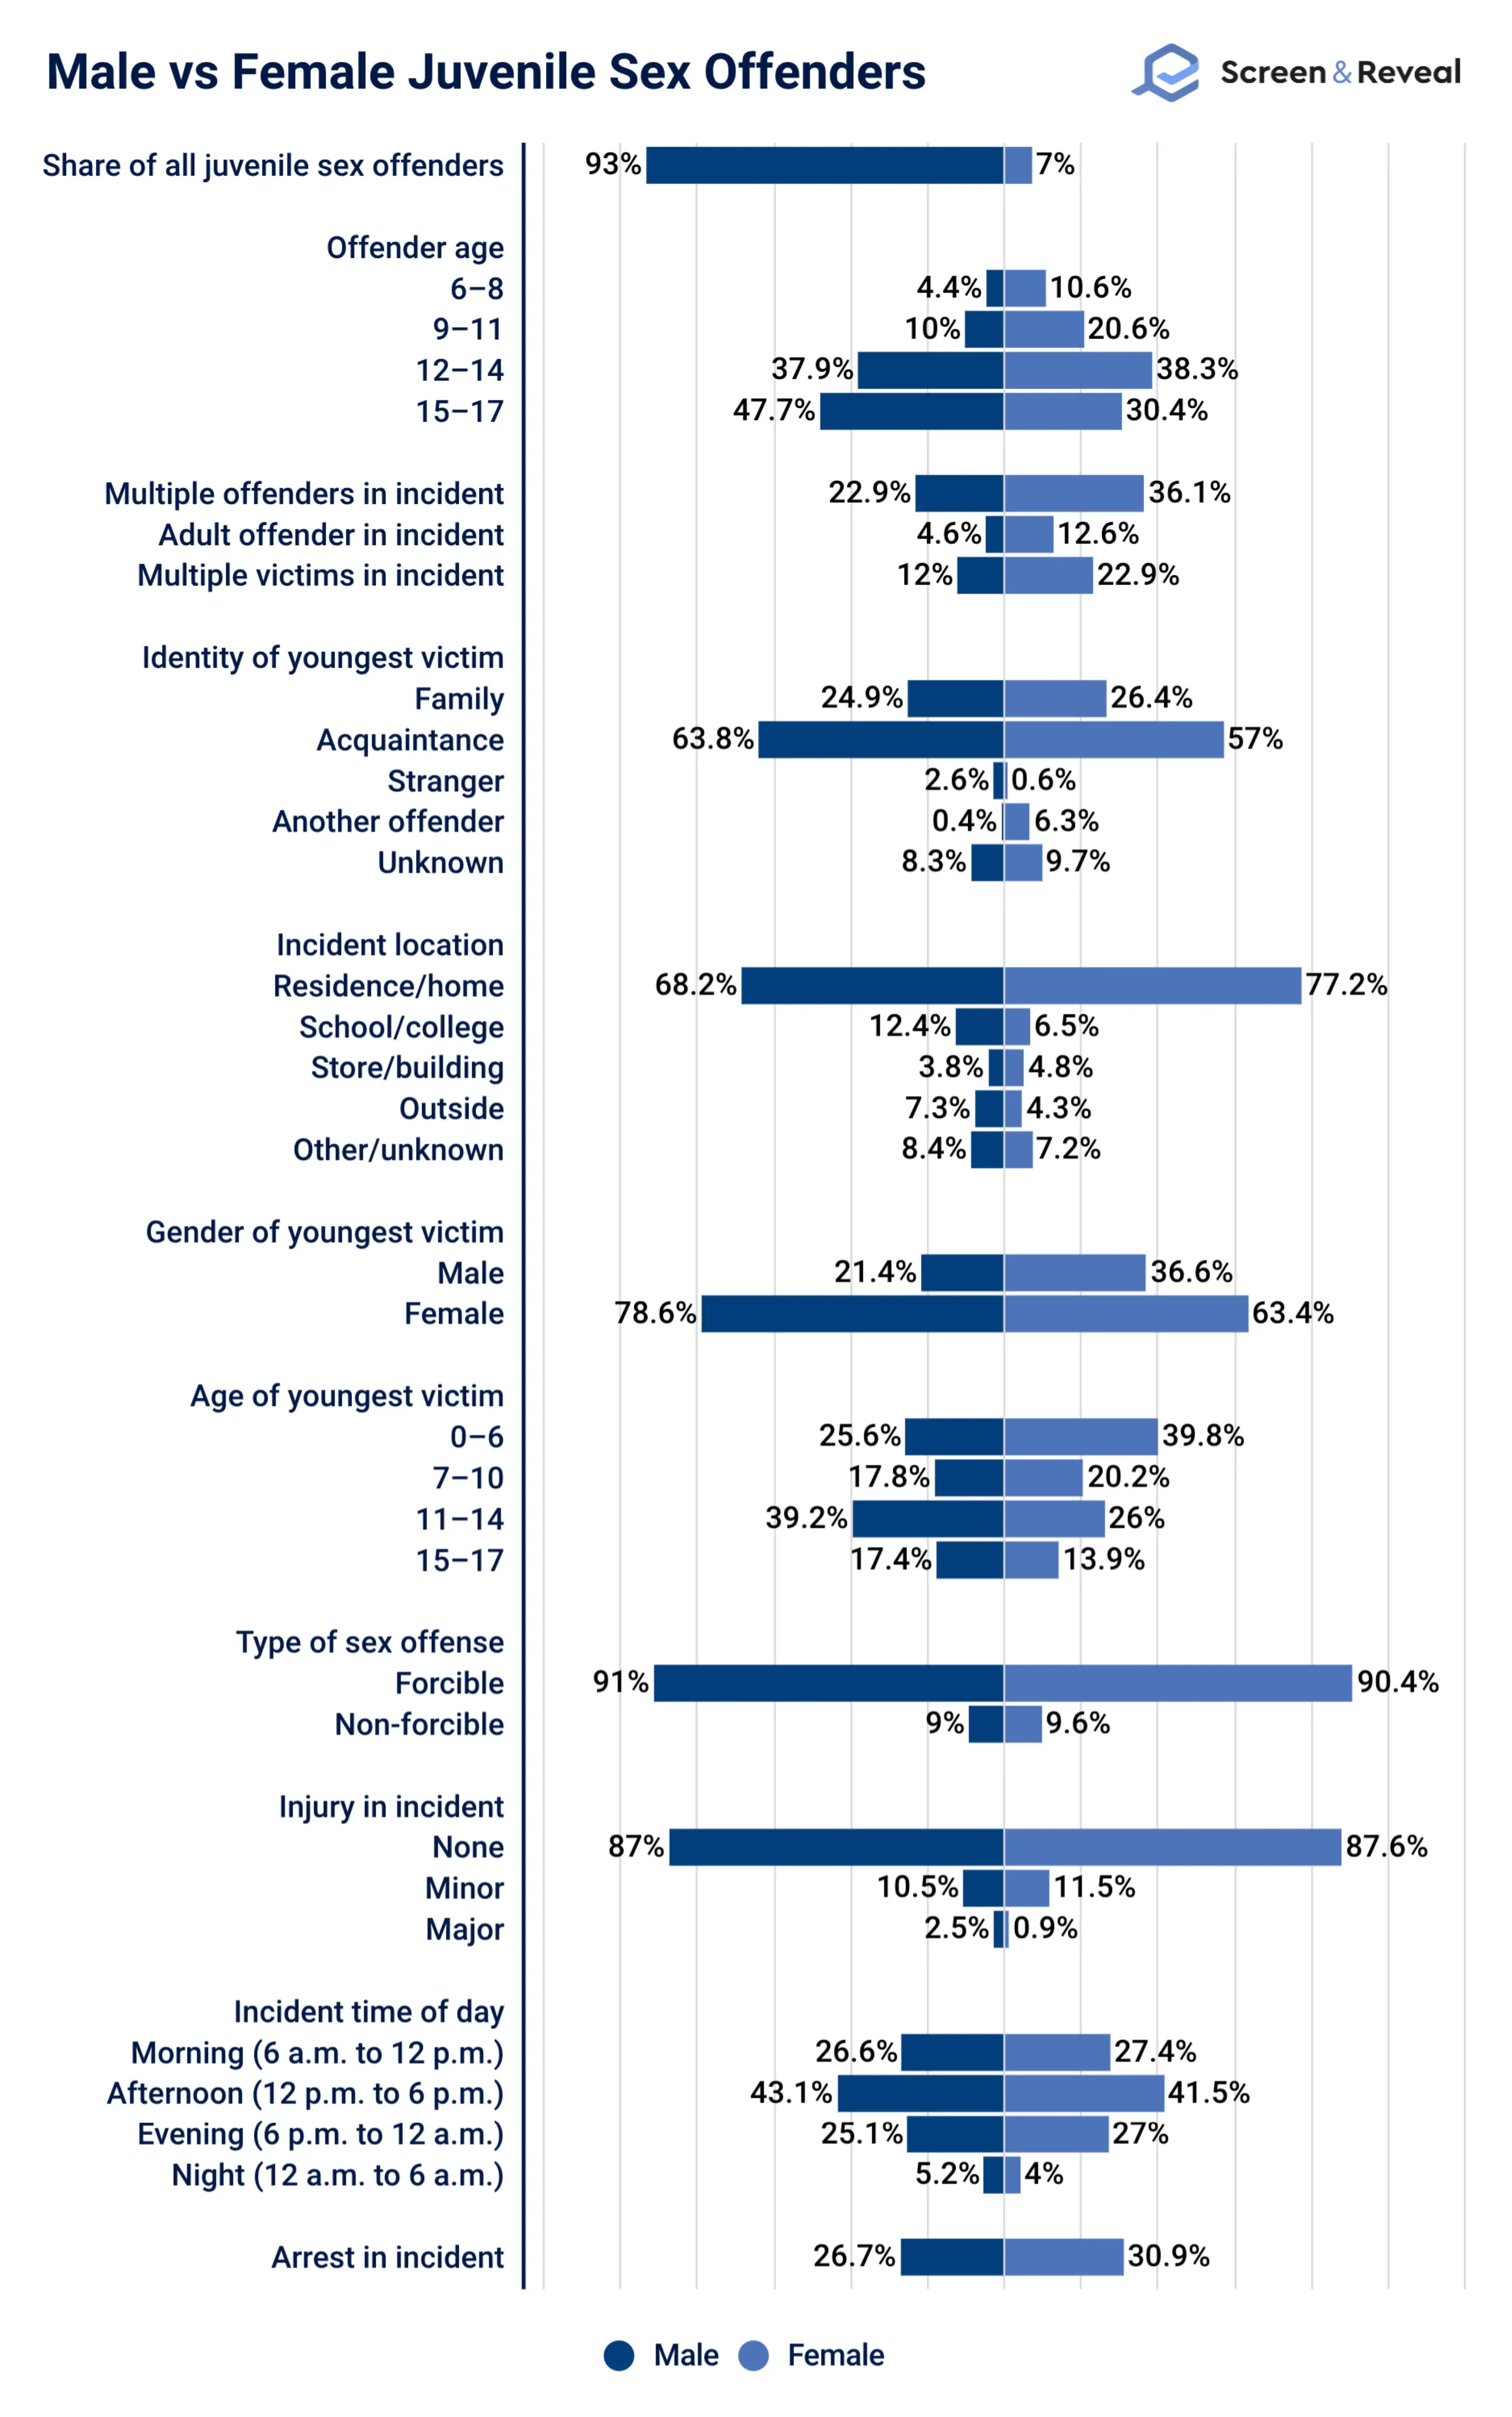
- The majority (or 46%) of juvenile sexual offenders who commit offenses against minors are aged between 15 and 17. The second-largest portion (or 38%) consists of 12-14-year-olds.
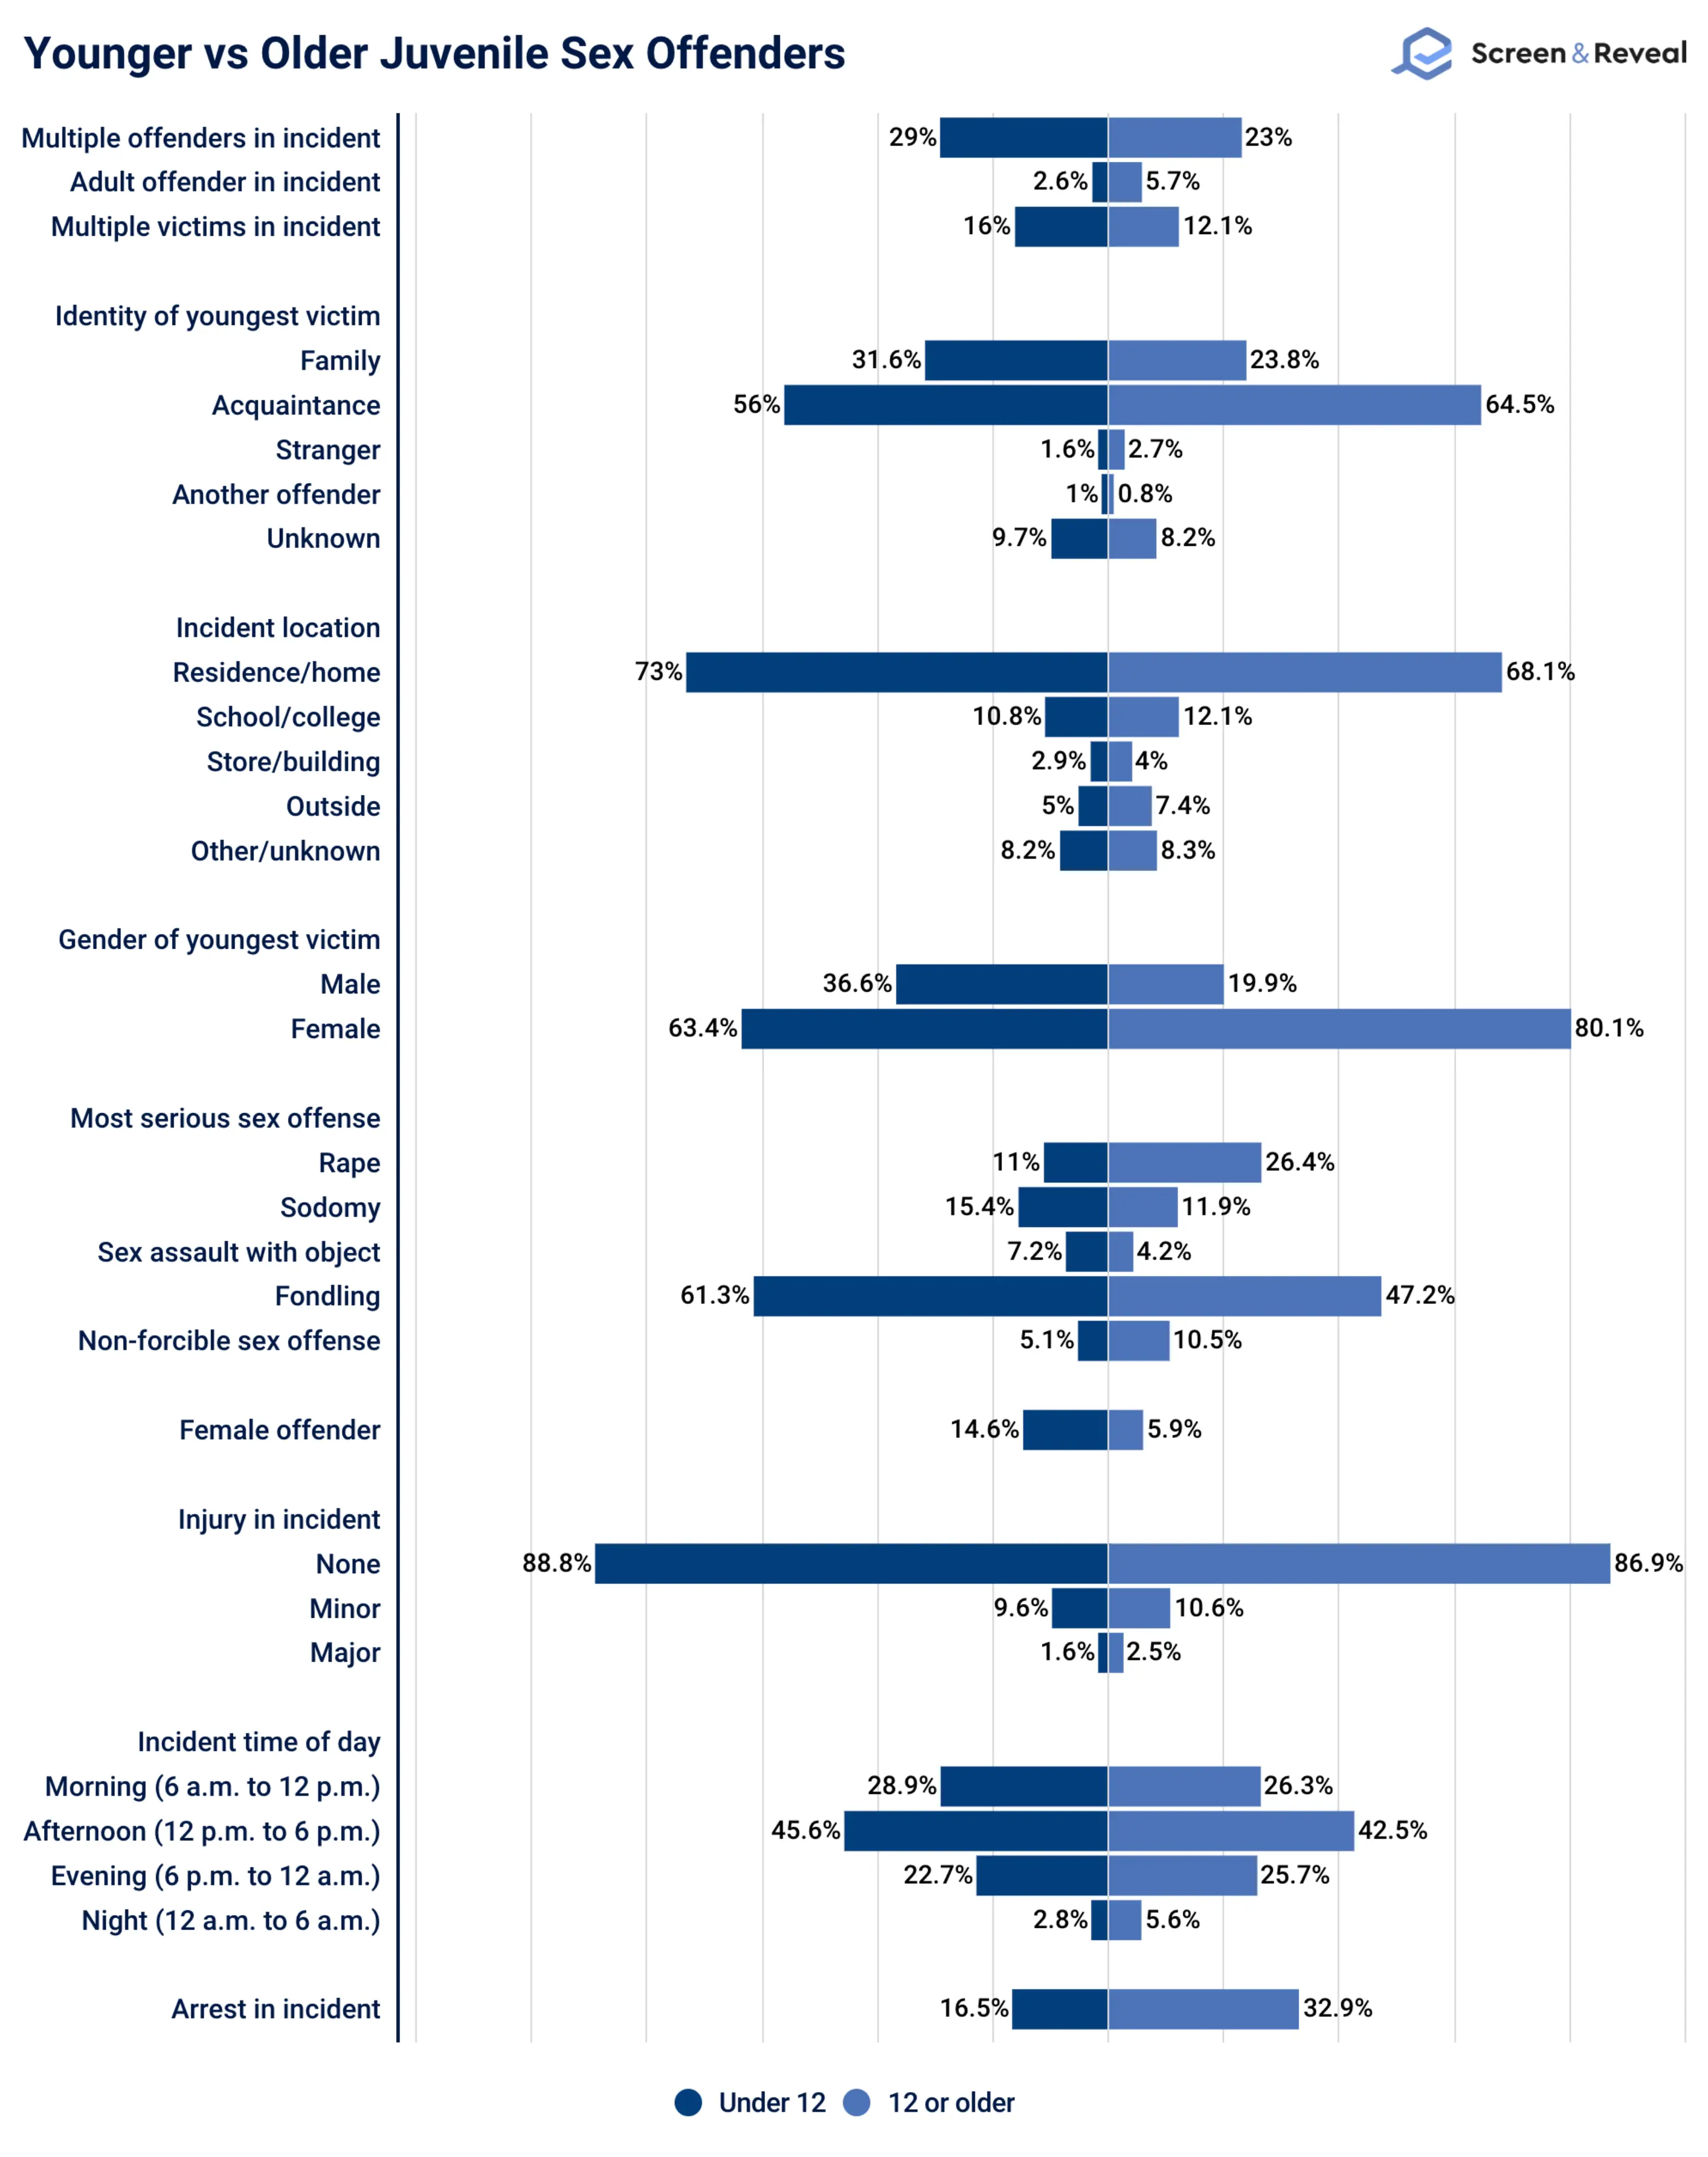
- Sex offenders under 12 are twice as likely to be female than those over 12. They’re also more likely to target male victims and ones up to ten years, regardless of gender.
- Male juvenile sex offenders are twice as likely to commit offenses at schools compared to their female counterparts. They’re also more likely to target 11-17-year-old victims.
- There are twice more female juvenile sex offenders aged 6-11 than males. They’re also more likely to target male victims.
Sexual Offender Facts – Juveniles vs Adults Committing Offenses Against Minors
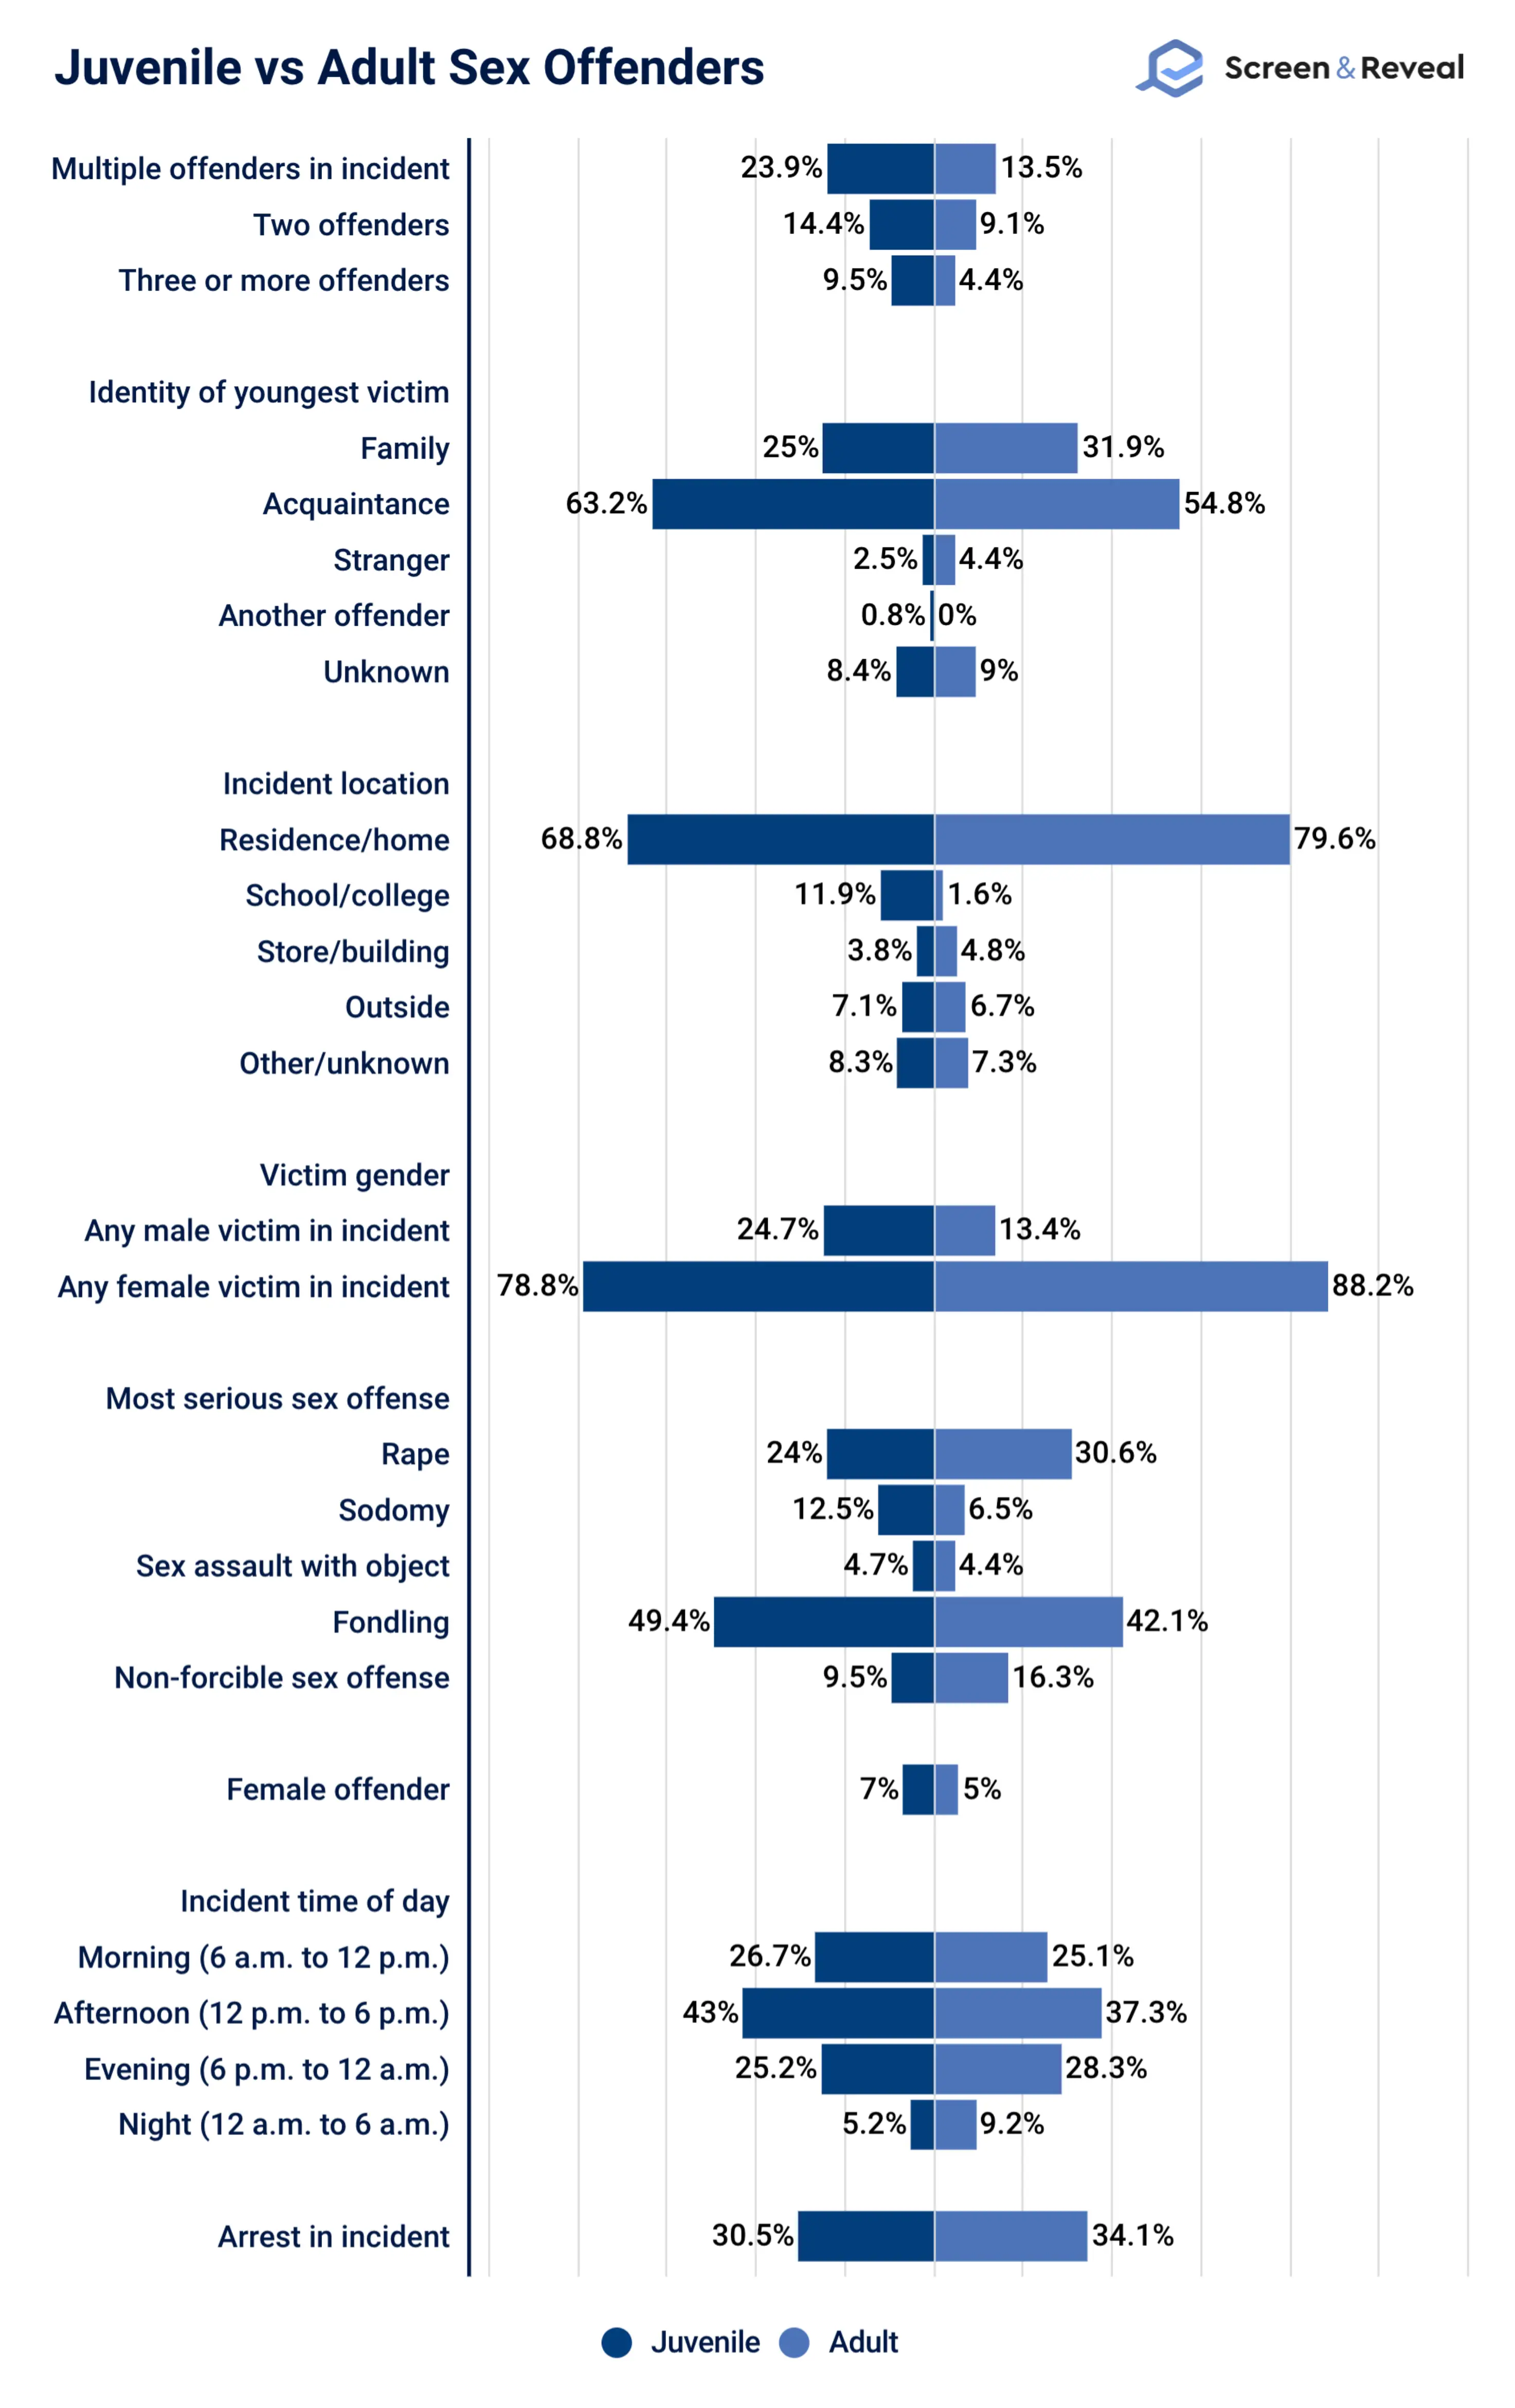
- Juvenile sex offenders are more likely to offend in groups and target acquaintances, as opposed to adults.
- Adult sex offenders’ most serious crime is more likely to be rape or non-forcible sex offense, and juveniles’ is more likely to be sodomy.
- Juvenile sex offenders are more likely to have male victims, compared to adults.
- Sex offenses against minors committed by adults are more likely to occur at home compared to the ones by juveniles. On the other hand, juvenile sex offenders are far more likely to offend at schools than their adult counterparts.
- Juveniles’ sex offenses against minors are more likely to happen in the afternoon than those of adults. Adult sex offenders, on the other hand, are slightly more likely to offend in the evening and night than juveniles.
- Compared to their adult counterparts, juvenile sex offenders are more likely to target young children as their victims.
- Juvenile sex offenders are much less likely to be arrested than their adult counterparts.
Statistics on Sex Offenders in Juvenile Facilities
- The vast majority (over 78%) of youth-on-youth sexual incidents in juvenile facilities involve a single perpetrator and a single victim.
- 57.1% of youth-on-youth sexual incidents in juvenile facilities occur in areas under video surveillance. The majority (41.5%) of such cases also occur in areas like temporary holding cells, instructional and recreation areas, medical, staff, and other areas, or in transit.
- 72.8% of perpetrators of youth-on-youth sexual incidents in juvenile facilities are male. In terms of age, the majority (46.4%) are 16-17 years old. By race, the majority (40.4%) are Black.
- Victims are injured in almost all (97.9%) youth-on-youth sexual incidents in juvenile facilities. 57.5% of perpetrators lose privileges as a sanction for the act.
Juvenile Sex Offender Recidivism Statistics
- The recidivism rate of juvenile sex offenders ranges between 5% and 14%, while the one of other delinquent behavior ranges between 8% and 58%.
- Juveniles who commit sex offenses have a 1.8%-12.8% chance of rearrest and a 1.7%-18% chance of reconviction for another sex offense.
- The recidivism rate of youth sex offenders receiving multisystemic therapy is 12.5%, the one of those receiving individual therapy is 75%, and the one of those treated in specialized programs ranges between 7% and 13%. The corresponding figures for non-sexual offenses are 25%, 50%, and 25%-50%, respectively.
Sex Offender Employment Statistics
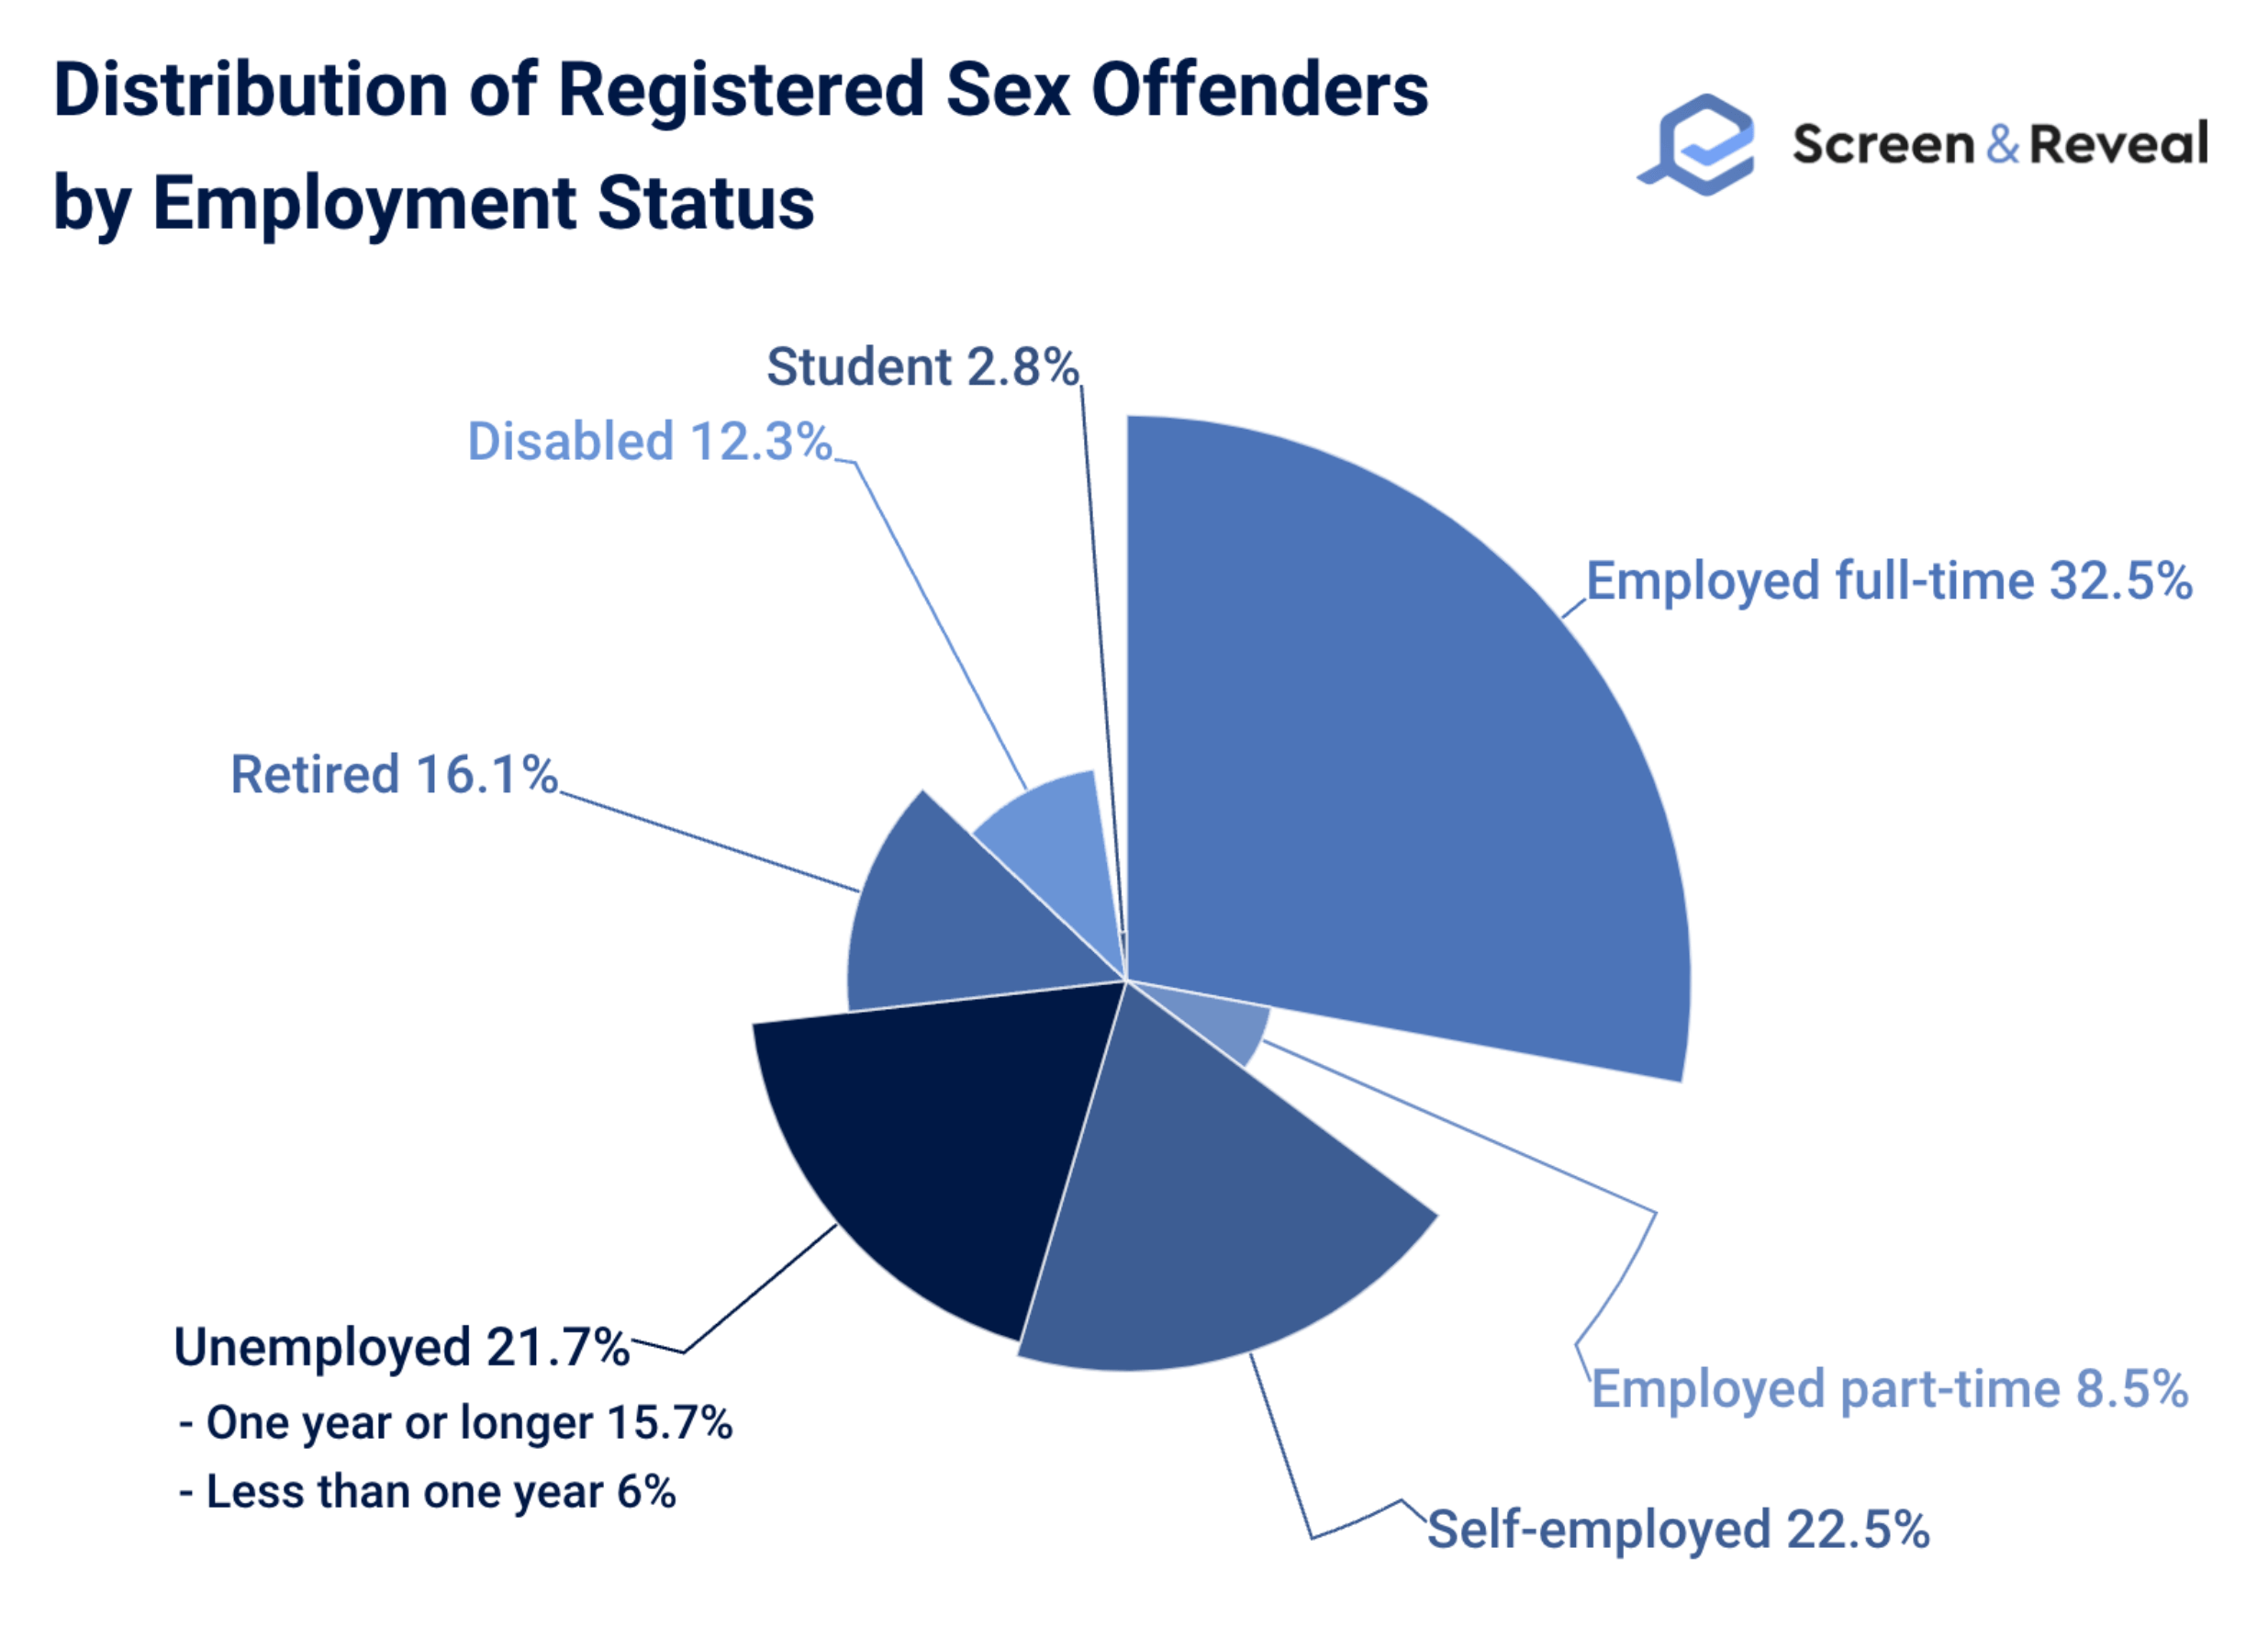
- 32.5% of adults on the US sex offender registry are employed full-time. Another 22.5% are self-employed, and 21.7% are unemployed.
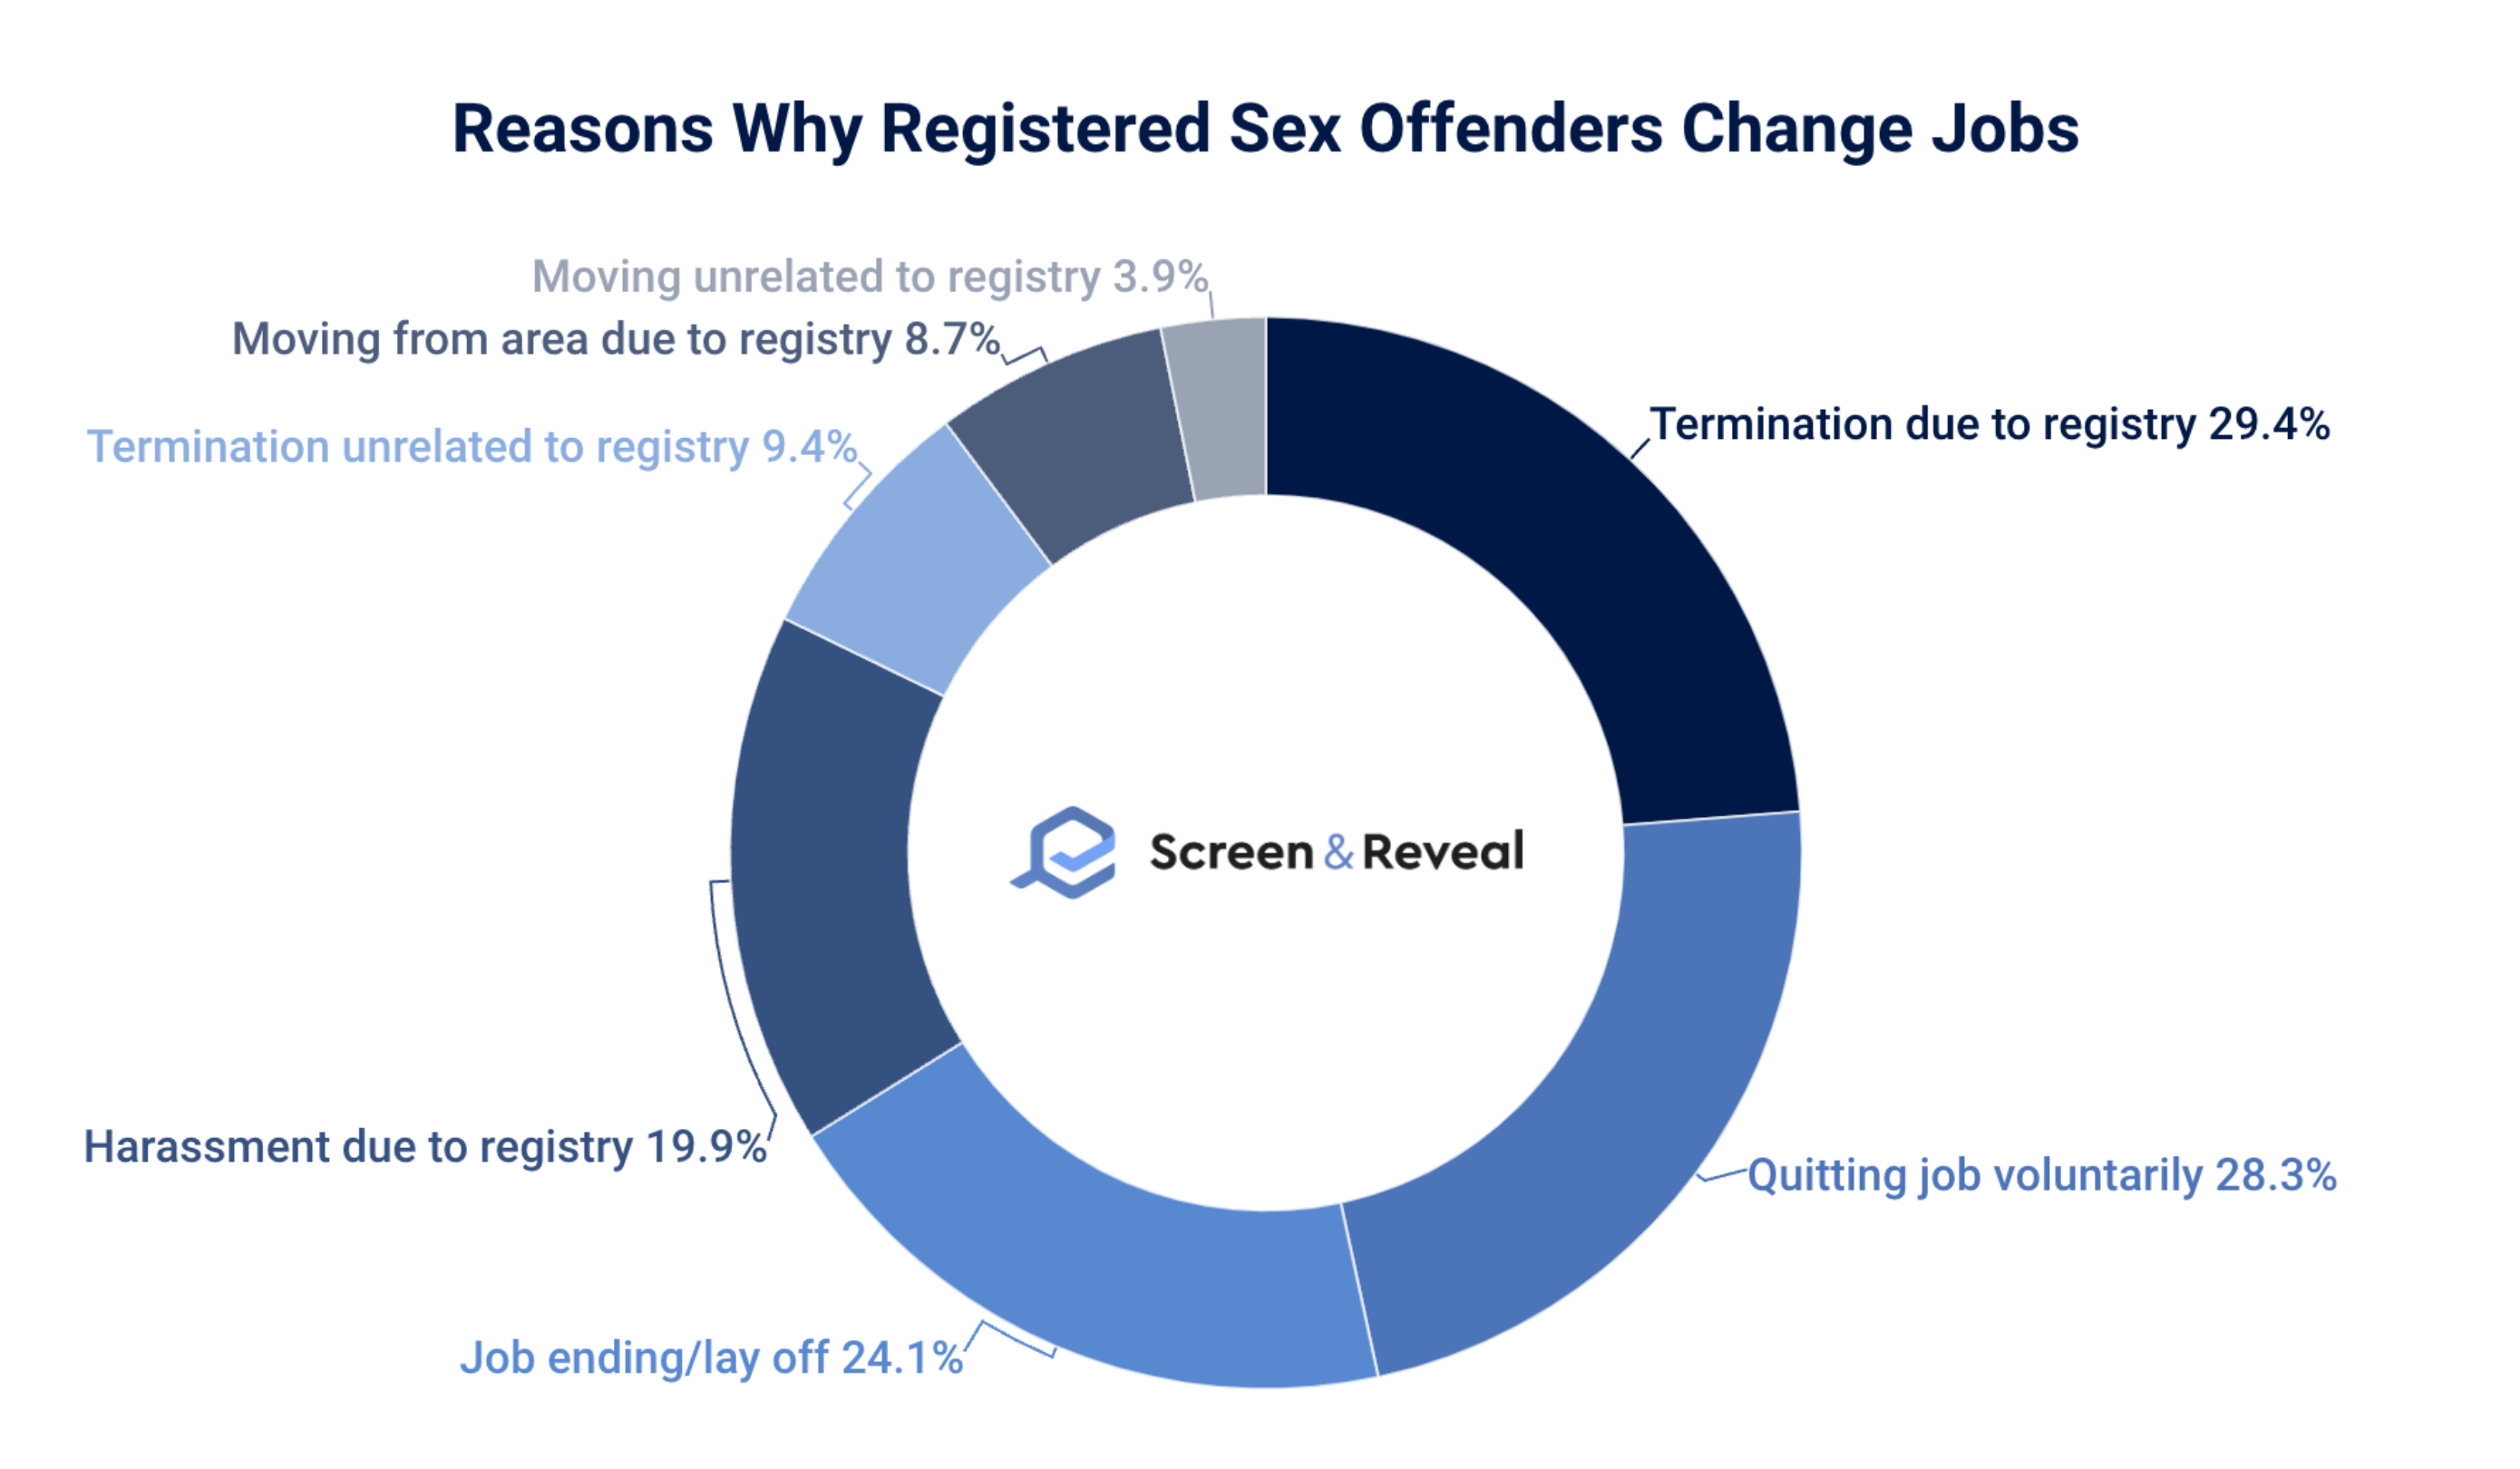
- 56.3% of adult registered sex offenders have lost a job due to being on the registry. Another 30.8% have been denied promotion for the same reason.
- 28.3% of adults on the US sex offender registry quit their jobs voluntarily.
- Sex offender data reveals that the highest portion (47.6%) of sex offenders are unemployed both at the start and end of their federal community supervision. The second-largest portion (25.5%) are employed at the end of their supervision only.
- Post-conviction supervision cases of sex offenders who are unemployed at both the start and end of supervision end up being successful 36.6% of the time. The corresponding figure for those who are employed at both stages is 87.7%.
- Respective 59.7% and 72.1% of sex offender cases revoked because of a new sex and non-sex offense are not employed at both the start and end of their supervision. The corresponding figures for the ones employed at both stages are 7.8% and 4.9%.
Sex Offender Demographics
- 50% of perpetrators of sexual violence are over 30 years old. 25% are 21-29, and 15% are 17 or younger.
- The average age of an adult on the US sex offender registry is 50.5.
- 42% of adults on the US sex offender registry have a household income below 200% of the federal poverty level.
- 55.4% of adult registered sex offenders in the US have an associate degree or above. 44.5% have some college or less, and 18.2% have received special education.
- Sex offender statistics by race reveal that 87.4% of adults on the US sex offender registry are White. The rest are BIPOC.
- 57% of perpetrators of sexual violence are White, and 27% are Black.
- According to sex offender statistics by gender, 96% of adults on the US sex offender registry identify as male. 3.2% of registered sex offenders are female, and 0.7% are transgender.
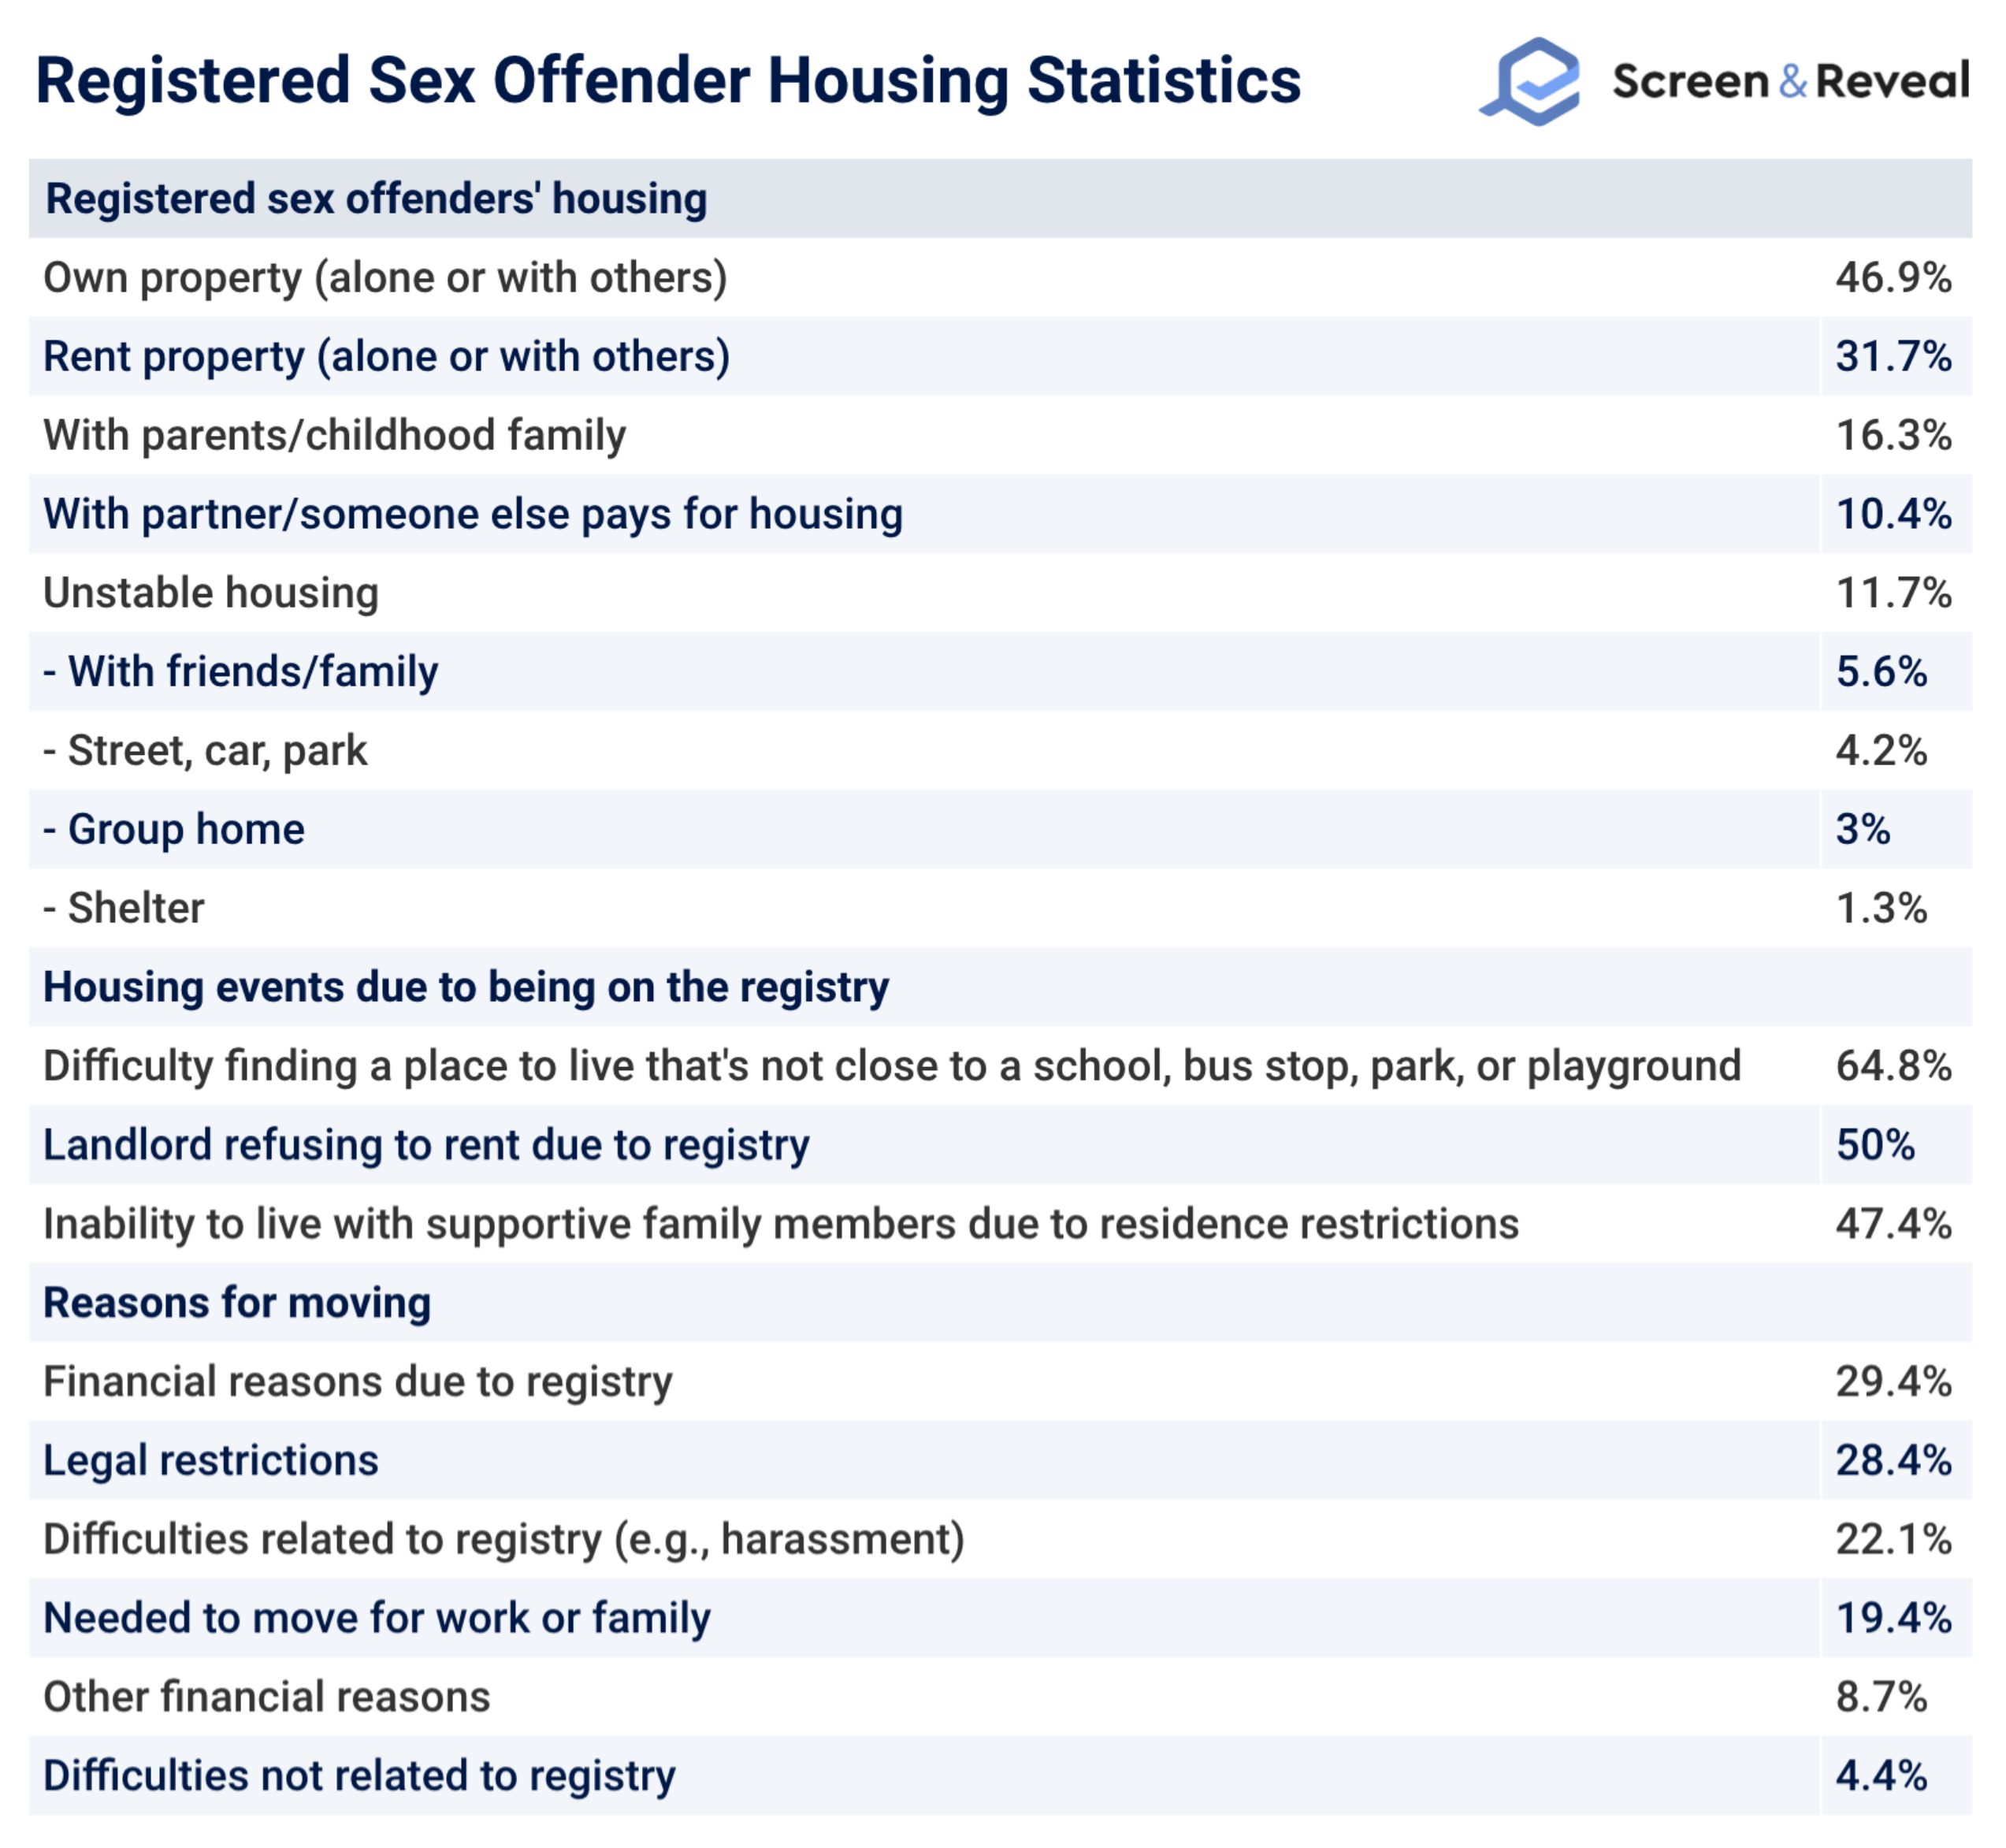
- With the emerging trends of using tenant screening services, 11.7% of registered sex offenders report unstable housing.
Sex Offender Statistics by Sexuality
- 19.9% of adults on the US sex offender registry are LGBQ. The rest are straight.
- With respective 29% vs 20% portions of the adult US sex offender registry, LGBQ sex offenders are more likely to be unemployed than their straight cisgender counterparts.
- 13.5% of adult registered LGBQ sex offenders have two or more sex offense convictions.
- Distributing, manufacturing, or possessing child pornography is the most common reason for conviction among both LGBQ and straight cisgender registered sex offenders adults in the US, at 34.4% and 28.4%, respectively.
- Compared to their straight cisgender counterparts, with respective 8.9% vs 2.7% portions of the adult US sex offender registry, LGBQ sex offenders’ offenses are more than twice as likely to include sodomy.
- With respective 2.1% vs 0.1% portions of the adult US sex offender registry, data on the sexuality of sex offenders reveals that LGBQ sex offenders are significantly more likely to be HIV positive than their straight cisgender counterparts.
- Sex offender statistics by sexuality reveal that 16.8% of LGBQ registered sex offender adults have three or more victims, which compares to 8.6% of their straight cisgender counterparts.
- Compared to their straight cisgender counterparts, with respective 16.8% vs 8.6% portions of the adult US sex offender registry, LGBQ sex offenders are nearly twice as likely to have three or more victims.
- 72.9% of LGBQ adults on the US sex offender registry have male victims, while 86.4% of their straight cisgender counterparts target females.
- At 46.2%, victims being represented in images are more common among LGBQ sex offenders than their straight cisgender counterparts (21.9%).
- At 39%, victims being family members are more common among straight cisgender sex offenders than their LGBQ counterparts (21.9%).
Castration of Sex Offenders Statistics
- A German study revealed that only 2.3% of castrated sex offenders relapsed into sex crime activity. The corresponding figure for those who didn’t undergo castration was 39.1%.
- A Swiss study found a recidivism rate of 7.44% among castrated sex offenders and 52% among those who weren’t.
- A US study revealed that 17.5% of chemically castrated sex offenders committed additional sex crimes, which were of lesser severity than the original crime. This compares to 35% of sex offenders who reoffended after stopping chemical castration therapy, and 58% of sex offenders who continued reoffending and never underwent such therapy.
- Sex offender castration statistics reveal that, even though mandatory under Florida law for repeat sex offenders, only a few people have received chemical castration injections since 1997.
- Under California law for sex offenders, to avoid indefinite incarceration, at least 15 repeat sexual offenders have requested surgical castration. At least two have been released from state mental hospitals following such procedures.
- In accordance with Texas sex offender laws, three men had undergone voluntary surgical castration between 1997 and 2005.
- As of 2019, mandatory chemical castration is part of the Alabama law for sex offenders, while prison officials experiment with antidepressant therapy under Colorado sex offender laws.
Sex Offender Rehabilitation Statistics
- 77.1% of adults on the US sex offender registry have received medical or psychological treatment related to the offenses they’ve committed.
- In 85.7% of cases, such treatments were mandated by a court, judge, or parole/probation officer.
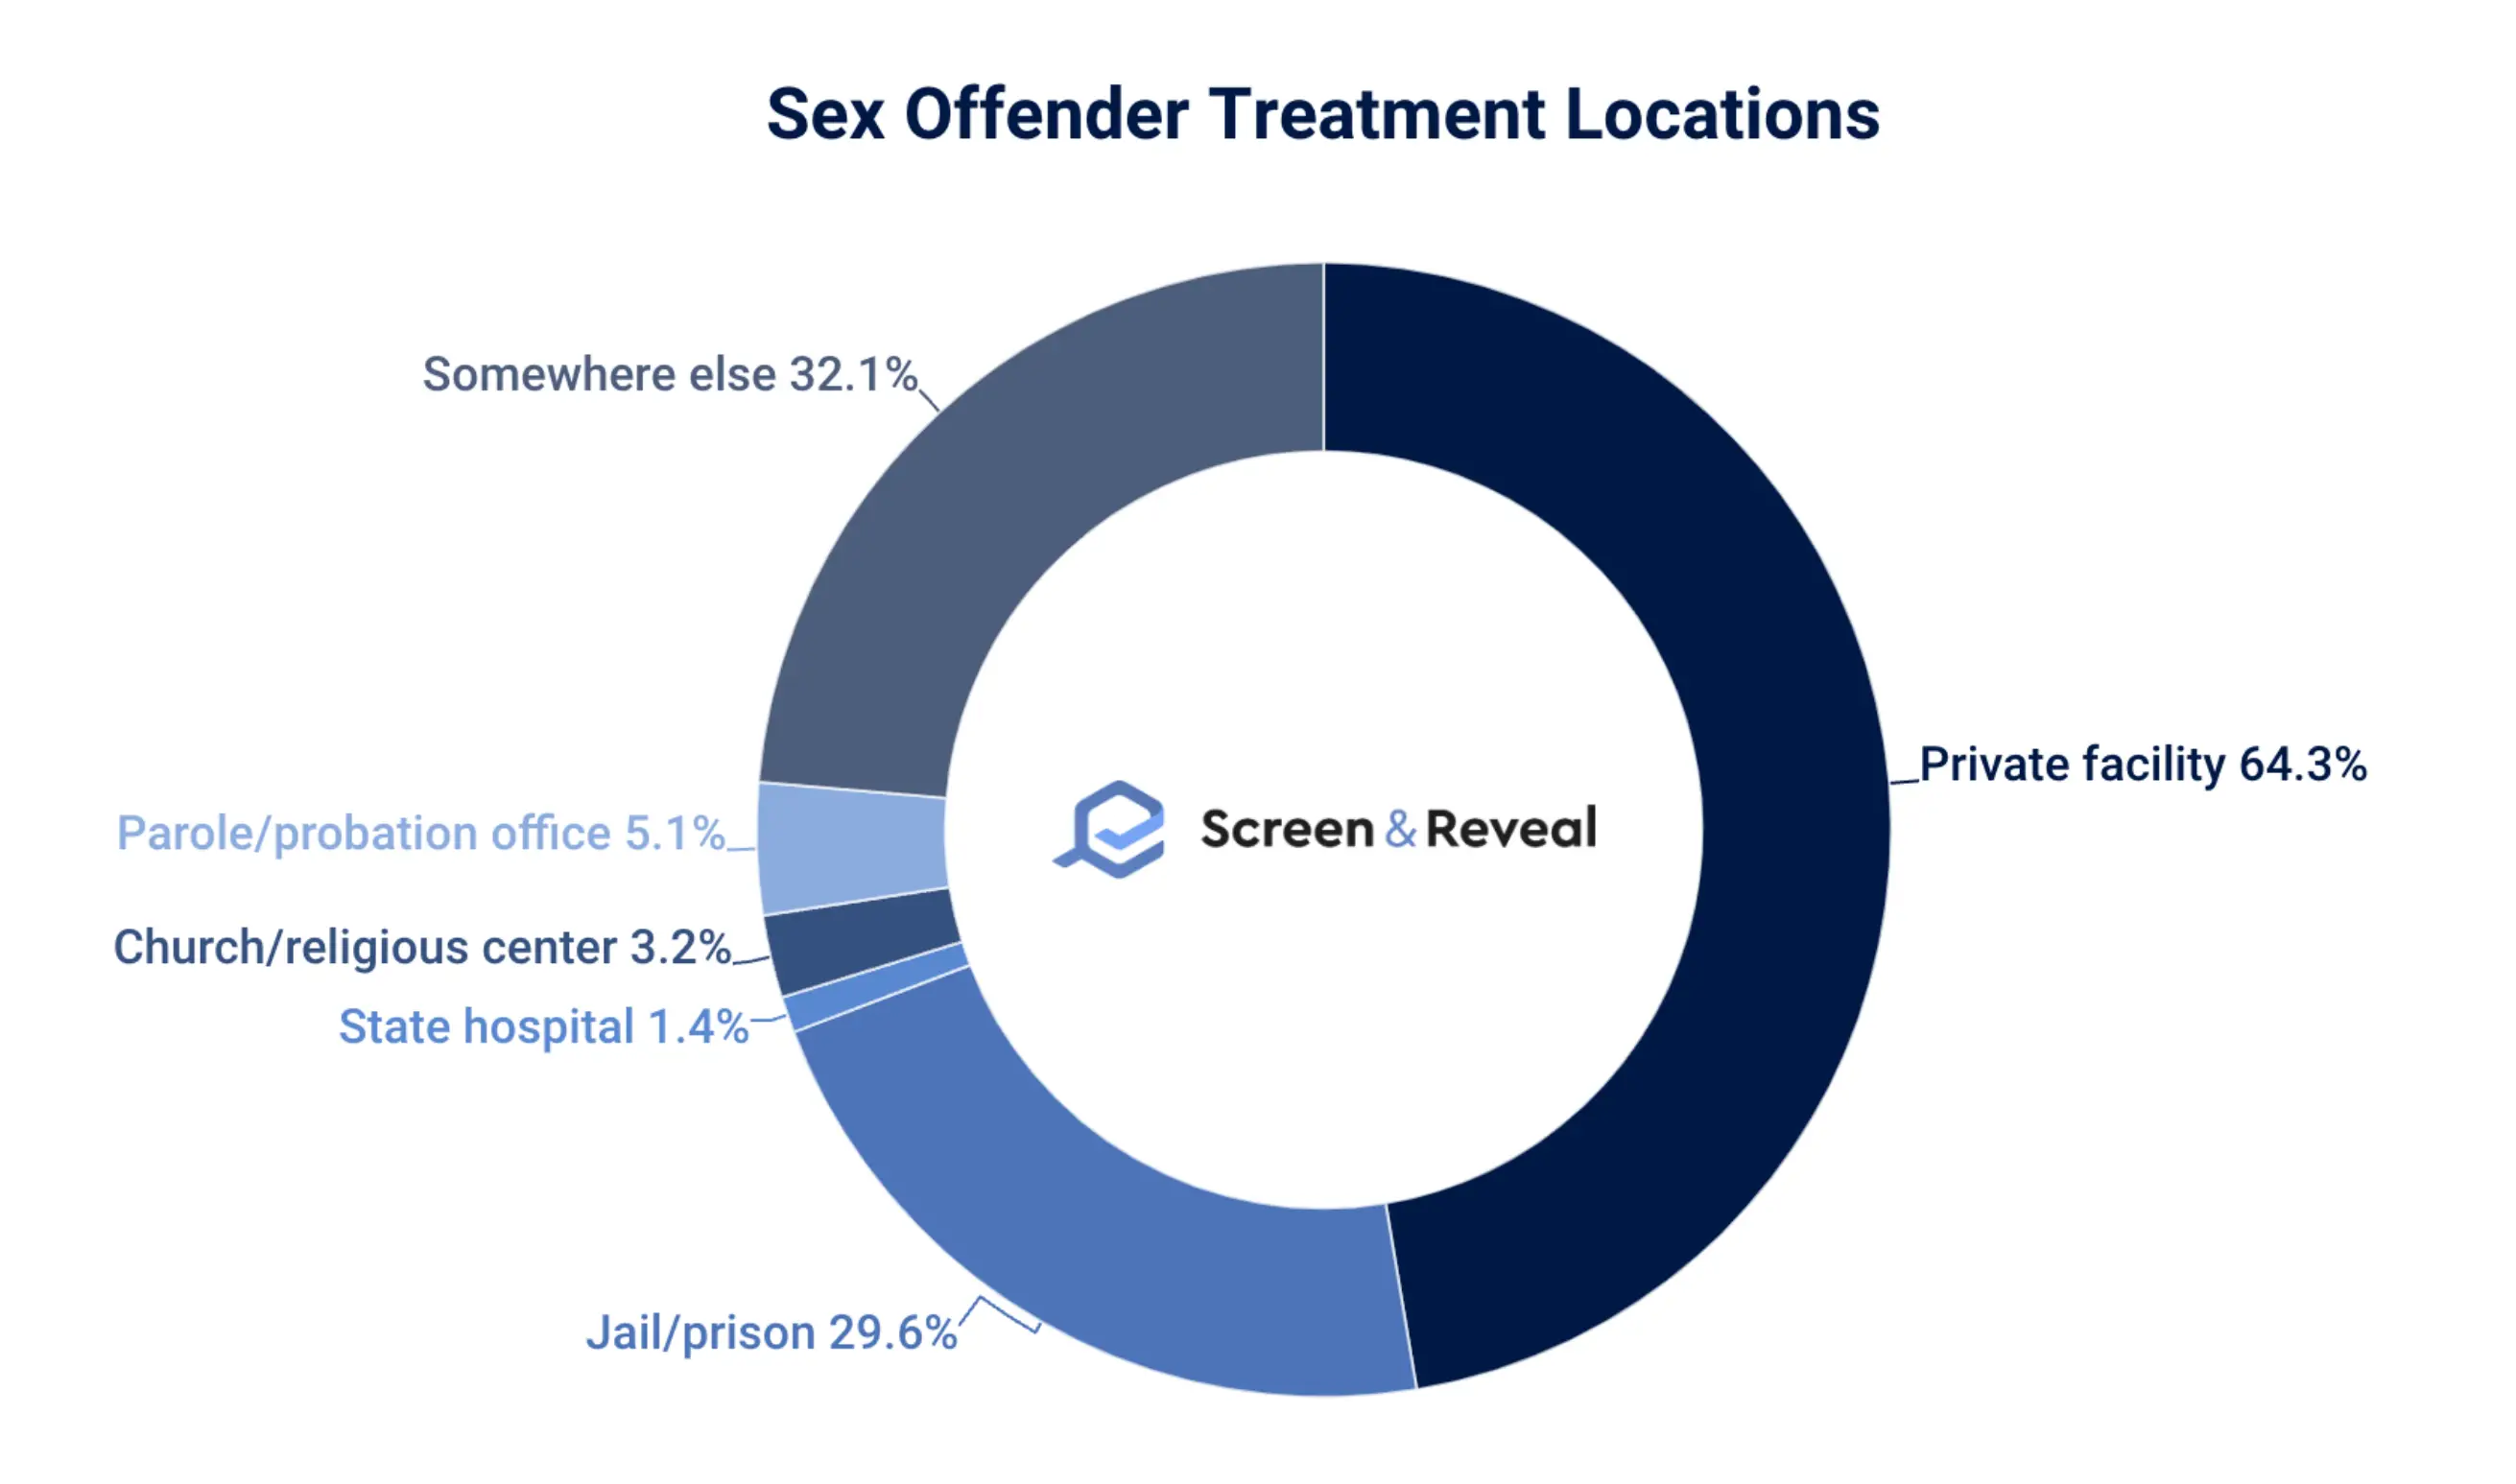
- 64.3% of sex offenders have received medical or psychological treatment related to the offenses they’ve committed in a private facility.
Sex Offender Recidivism Statistics
- Sex offender recidivism is understated in official records, considering only about a quarter of rapes or sexual assaults are reported to the police, and only 17% of victims’ reports result in the conviction of the perpetrator.
- 14% of sex offenders are charged or convicted for new offenses within five years of their latest ones. This figure increases to 20%, 24%, and 27% after 10, 15, and 20 years, respectively.
- The average recidivism rate for treated sex offenders is estimated at 27.9% and 39.2% for their untreated counterparts.
- Repeat sex offender statistics reveal that, at an average of 13%-14%, male sexual offenders have a much higher recidivism rate than female ones (1%).
- It’s estimated that 5% of rapists released from prison are re-arrested for a new sex offense within three years. Of them, 2.5% are re-arrested for another rape.
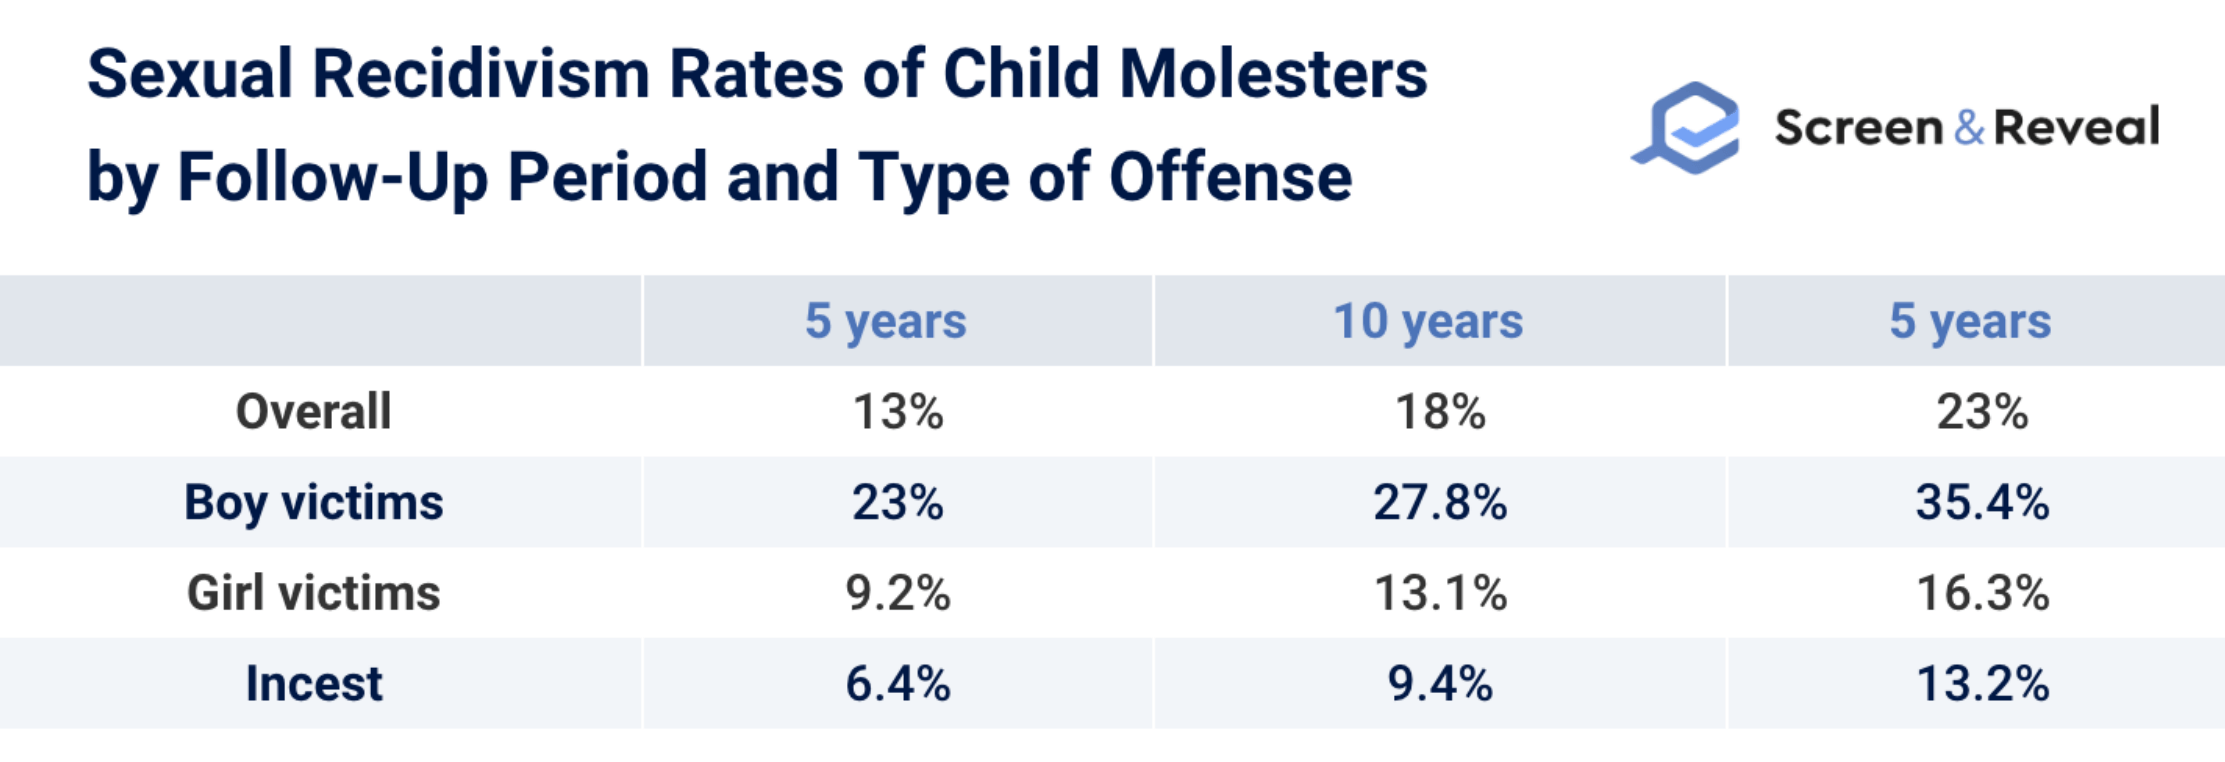
- 13% of child molesters are charged or convicted for new offenses within five years of their latest ones. This figure increases to 18% and 23% after 10 and 15 years, respectively.
- An estimated 39.1% of treated exhibitionists and 57.1% of untreated ones recidivate within nine years. Studies also suggest that 32% of exhibitionists are convicted for a contact sexual offense within 17 years of their latest offense.
Facts About Sex Offenders
- 38.7% of registered sex offenders have a probably serious mental illness.
- As much as 70.8% have had suicidal ideas, and 26% have attempted suicide. Of them, 50.2% did so after they were convicted.
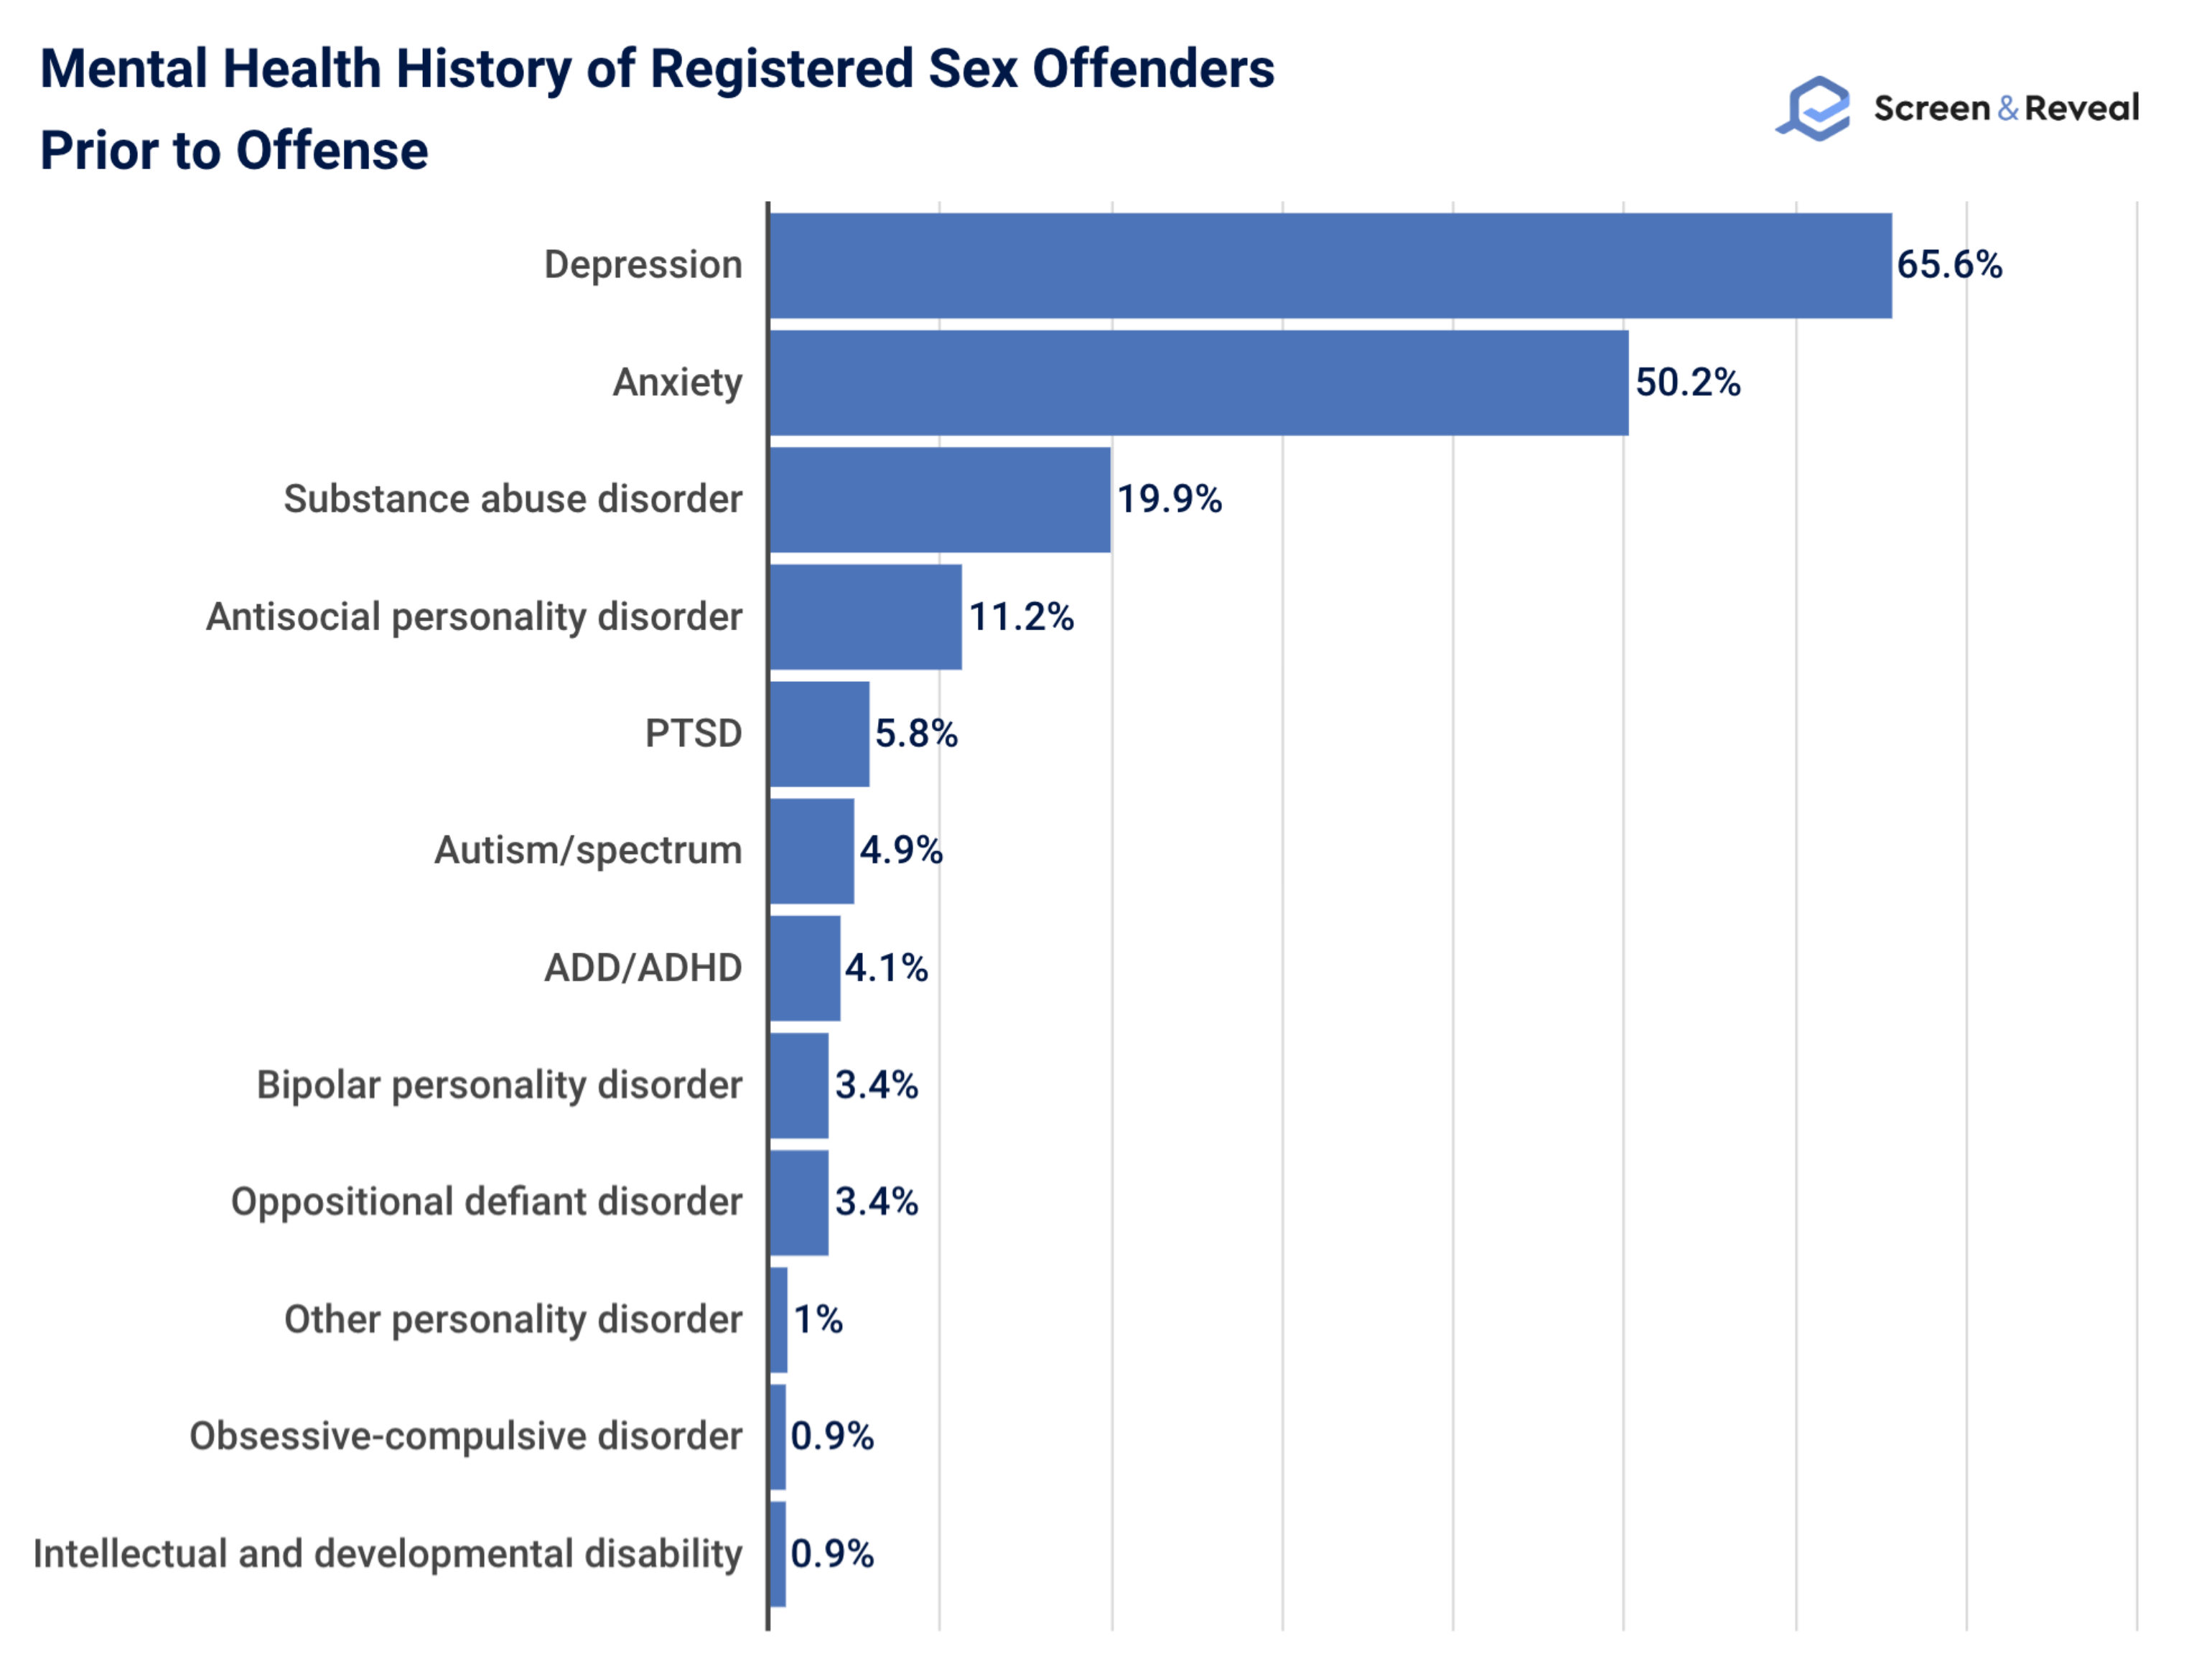
- As much as 65.6% of registered sex offenders have struggled with depression prior to their offense.
- 60.1% of registered sex offenders are in commited relationships. Of them, 68% are in one for six years or longer.
- 57.2% of registered sex offenders say most of their friends and family know about their conviction. None or only some friends or family are aware of the conviction of 32.9% of registered sex offenders.
How many sex offenders were victims themselves?
As much as 42% of sex offenders have experienced sexual abuse in their childhood. However, the majority, or 62.6%, had a parent or adult who swore, insulted, or put them down.
How many victims does the average sex offender have?
The average number of sex offenders’ victims depends on both the perpetrators’ and victims’ ages, as well as the type of offense committed.
For instance, rapists have an average of seven, while child abusers have an average of 76 victims. In comparison to child abusers who obejctify their victims, pedophiles have fewer victims on average, due to their deviant sexuality making them pursue a persistent relationship with a child.
What percentage of sexual abuse is committed by someone the victim knows?
Over 80% of sexual assault cases are commited by someone the victim knows. This figure increases to 93% among juvenile victims.
How much jail time do sex offenders get?
The punishments for sex offense misdemeanors and felonies range from as little as 180 days in jail to as much as 99 years in prison.
Felonies like sexual assault and child molestation are usually charged with:
- 180 days to two years in state jail for state jail felonies;
- Two to ten years in prison for third-degree felonies;
- Two to ten years in prison for second-degree felonies;
- Five to 99 years in prison for first-degree felonies.
All of the above can come with fines up to $10,000, as well as sex offender registry requirement.
Misdemeanors like first-time prostitution and public indecency are usualy charged with:
- Up to a year in jail and up to $4,000 in fines for a class A misdemeanor;
- Up to 180 days in jail and up to $2,000 in fines for a class B misdemeanor;
- Fines up to $500 for a class C misdemeanor.
How many sex offenders are killed in prison?
A study conducted when male sex offenders accounted for 15% of the US prison population revealed that this group also accounted for 30% of homicide victims in such facilities.
What countries do not allow sex offenders?
While registered sex offenders are allowed to have passports, they are currently not allowed to travel to Australia, Canada, China, Japan, Russia, Thailand, and the UK.
Sources: ACA, BJS, Core, FindLaw, ICASA, JPI, OJJDP, OJP, RAINN, SafeHome.org, Sharp Criminal Attorney, Simmrin Law Group, SMART, The Guardian, US Courts, Williams Institute