Every 68 seconds, someone in the US is sexually assaulted. Unfortunately, sexual assault is among the most common forms of crime in American society and the most underreported one. Acts of sexual violence can have severe physical, psychological, and emotional consequences on the victims, keeping them in the vicious cycles of trauma. To understand the system’s weaknesses and the potential actions we need for better prevention and response to sexual violence, take a look at the data behind the problem. Below, we give you a 360-degree view of the most critical sexual assault statistics, breaking data down into different categories.
Sexual Assault Statistics (Editor’s Choice)
- Women aged 25 to 34 are at the highest risk of sexual assault and harassment. (NSVRC)
- One in five women in the US has been a victim of an attempted or completed rape. (NSVRC)
- 91% of rape and sexual assault victims are female. (NSVRC)
- Rape costs the US around $127 billion annually, more than any other crime. (End Sexual Violence)
- 63% of sexual assaults are not reported. (BJS)
- LGBTQ people face a higher risk of being sexually assaulted. (NSVRC)
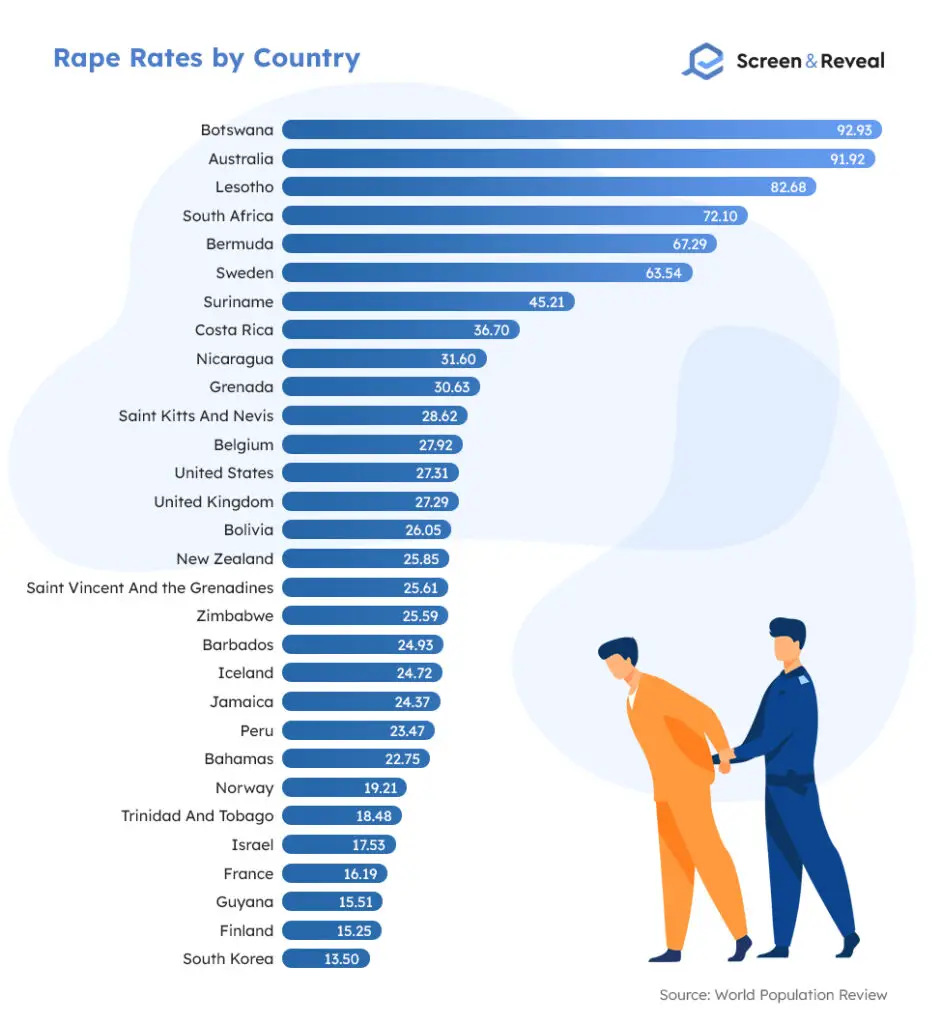
- South Africa is the country with the highest rape rate in the world, 132.40 per 100,000. (World Population Review)
- Date rape is most prevalent among adolescents. (PubMed)
- Approximately 13,000 abortions each year are a result of rape or incest. (National Abortion Federation)
- One in 10 women is a victim of marital rape. (NCADV)
- There have been over 20,000 complaints of sexual abuse in nursing homes over the past twenty years. (NHLC)
1. False Rape Statistics
Remember the viral tweet “The real #HimToo is that men are more likely to be sexually assaulted than falsely accused.”? While there isn’t any official report to justify this statement, the reality is that false accusations are incredibly rare. Fraudulent claims account for only 2% to 10% of all rape reports. Although rare, false rape accusations are a crime and can negatively affect falsely accused people.
(PubMed)
2. Rape Statistics by Race
Multiple studies show that no particular race is more prone to committing rape than others. Therefore, the old belief that interracial rape (Black rapist assaulting a white victim) is more prevalent is also false. Even in communities with high Black poverty, unemployment, and racial inequality, that isn’t the case. Given that white people comprise 66.1%, Black people account for 12.2%, Asians make 5.6%, American Indian and Alaska Native 0.7%, and Native Hawaiian 0.2% of the total US population, interracial rape statistics suggest that the percentage of rapists by race corresponds with their representation in the total population.
- According to FBI 2019 data, a total of 16,599 people were arrested for rape-related charges, out of which the majority were White and Black.
- When it comes to arrests under 18, rape statistics show that of the total 2800, 1,990 were white, and 732 were Black.
- With arrests for rape over 18 years old, a total of 13,799 people were arrested in 2019, out of which 9,598 were white, and 3,695 were Black.
(FBI UCR)
3. Sexual Assault Statistics by Gender
Sex offenders stats show that over 90% of sexual assault victims are female, and the majority of offenders are male. While there are cases of same-gender sexual assault, it mostly happens between victims and perpetrators of different genders. The troubling statistics below show only a portion of the reality for millions of abused victims, especially women, as rape and sexual assault are among the most underreported crimes.
- 91% of rape and sexual assault victims are female compared to only 9% male victims. (NSVRC)
- One in five American women is a victim of attempted or completed rape. (NSVRC)
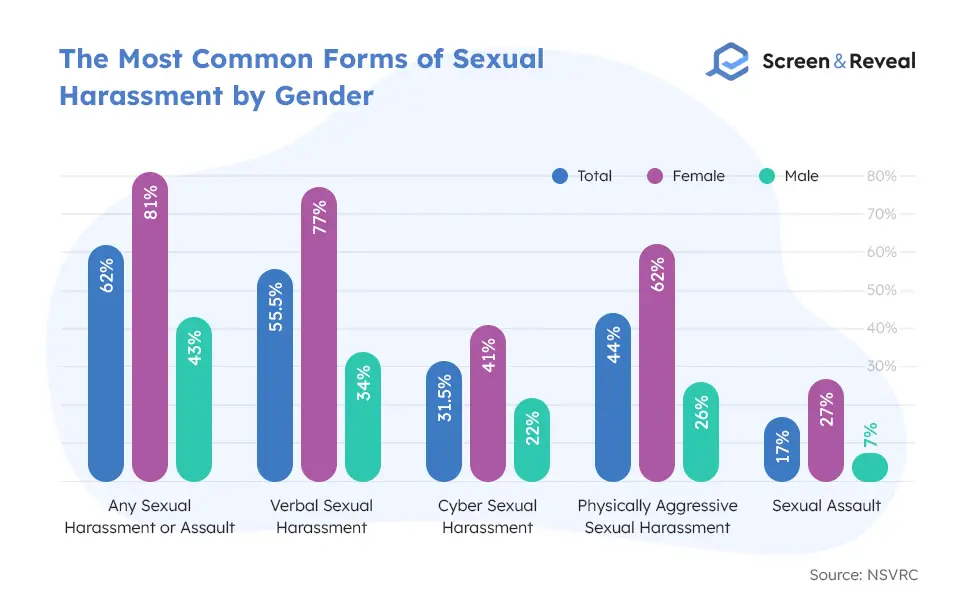
- 81% of women and 43% of men report having experienced sexual harassment or assault. (NSVRC)
- Male vs. female rape statistics show 27% of women and 7% of men have reported a sexual assault. (NSVRC)
- 77% of women and 34% of men have experienced sexual harassment. (NSVRC)
- 51% of women and 17% of men report being sexually touched against their will. (NSVRC)
- 41% of women and 22% of men report cyber sexual harassment. (NSVRC)
- 34% of women and 12% of men have experienced a physical following. (NSVRC)
- 30% of women and 12% of men have witnessed unwanted genital exposure. (NSVRC)
- Women with disabilities are more likely to experience sexual assault, with 40% reporting such cases compared to 23% of women without disabilities. (NSVRC)
- Socially marginalized men are more likely to experience and report assault than other men. (NSVRC)
- 57% of women and 42% of men report having experienced sexual harassment and assault by the time they were 17 years old. (NSVRC)
- Statistics about sexual assault show that 66% of women report some form of sexual assault in public space, making it the most frequent location where they’ve experienced sexual harassment, compared to only 19% of men who reported the same. (NSVRC)
- 38% of women report experiencing sexual harassment at work. (NSVRC)
- Among those who report sexual assault or harassment, 31% of women and 20% of men admitted feeling anxiety and depression after the troubling event. (NSVRC)
- Women aged 25 to 34 are most likely to report experiencing all forms of sexual assault and harassment, while women aged 65+ are the least likely to report any form of sexual assault except for physically aggressive harassment. (NSVRC)
- Male rape statistics show that men aged 25 to 49 are most likely to report experiencing sexual harassment, while men aged 35 to 49 are more likely to report sexual assault than other age groups. (NSVRC)
- Stranger-in-person is the most commonly listed perpetrator of sexual harassment among 42% of women and 27% of men. (NSVRC)
- In 2019, in around 272,240 cases of rape or other sexual assault in the US, the offenders didn’t have any weapon, while 5,156 victims reported a knife during the incident. (Statista)
- Verbal sexual harassment is the most common form of sexual assault, with 77% of women and 34% of men reporting such cases. (NSVRC)
- 62% of women and 26% of men report experiencing physically aggressive forms of sexual harassment. (NSVRC)
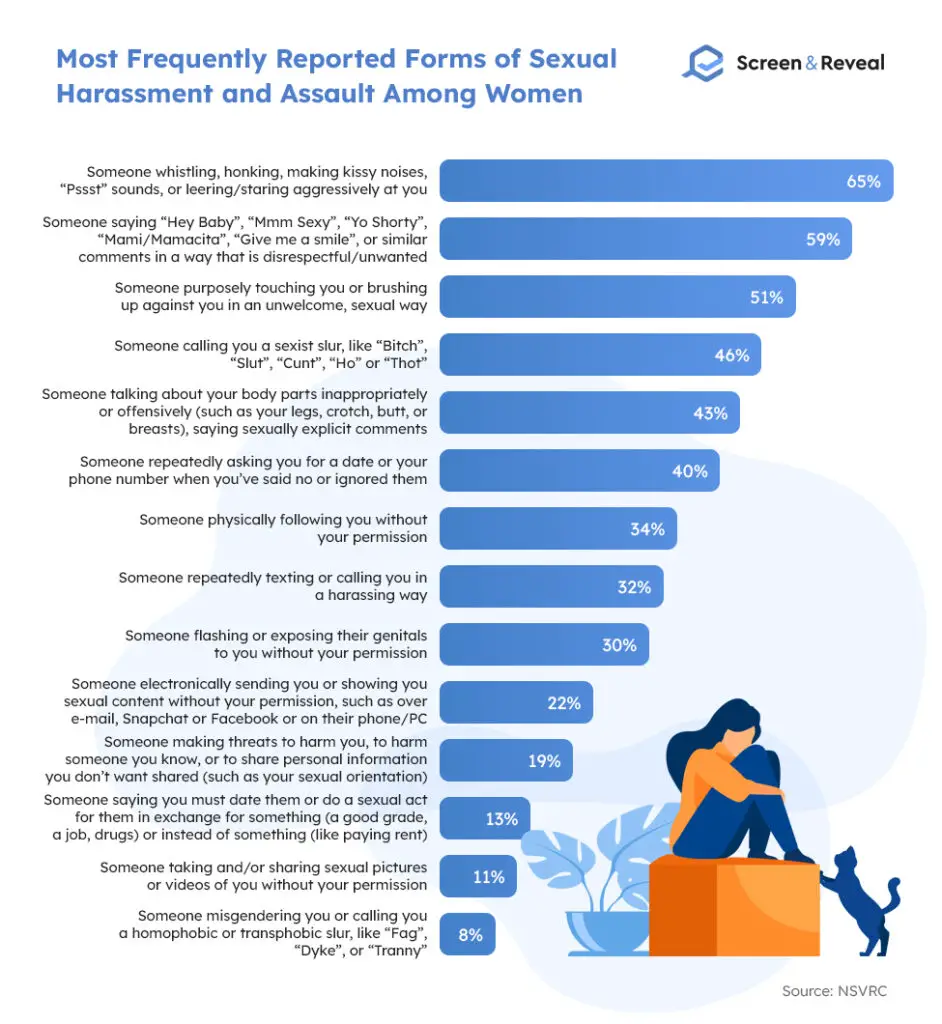
3.1. The Top Five Most Frequently Reported Forms of Sexual Harassment and Assault Among Women
Sexual assault statistics show that the majority of women (65%) report having experienced whistling, honking, kissy noises, weird “Pssst” sounds, and aggressive staring, followed by 59% of women who report having experienced sexually charged comments, and over half who report experiencing unwanted sexual touches. (NSVRC)
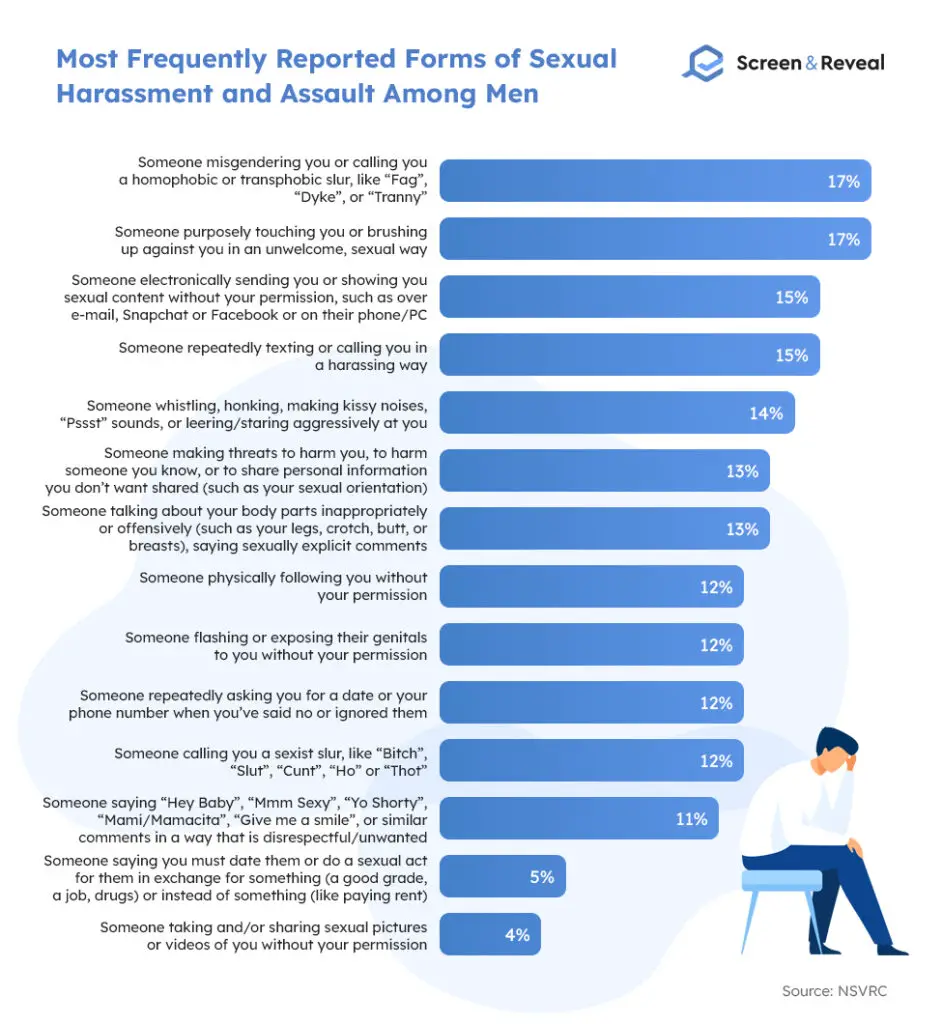
3.2. The Top Five Most Frequently Reported Forms of Sexual Harassment and Assault Among Men
Men are far less likely to become a victim of sexual harassment and assault. 17% of them report experiencing being called homophobic, transphobic, or having someone misgender them, and another 17% report experiencing undesired sexual touches. (NSVRC)
4. LGBT Sexual Assault Statistics
As a marginalized group, LGBTQ individuals are at higher risk of being sexually abused and more likely to face abuse from law-enforcement professionals and professionals in helping roles. These people are also more likely to be taken less seriously by the institutions that should protect them because of their sexual orientation.
- 48% of lesbian and bisexual women report having experienced sexual assault compared with only 25% of straight women. (NSVRC)
- 42% of gay and bisexual men report having experienced physically aggressive sexual harassment compared with 25% of straight men. (NSVRC)
- 19% of gay and bisexual men report facing sexual assault compared with only 6% of straight men. (NSVRC)
- Transgender sexual assault statistics show that 22% of homeless transgender people have experienced an assault during their stay in shelters. (Transequality)
- Incarcerated transgender people are five times more likely to be sexually assaulted by prison or jail staff than the general population and nine times more likely to be sexually assaulted by other inmates. (Transequality)
- Transgender individuals in shelters are nearly six times more likely to report experiencing sexual assault (23%) than gender-non-conforming people (4%),. (Transequality)
- Transgender sexual assault statistics unveil that 72% of transgender people who have done income-based sex work were sexually assaulted at some point in their lifetime. (Transequality)
- Nearly half (47%) of transgender people were sexually assaulted at some point in their lifetime, and one in ten (10%) were sexually assaulted in the past year. Respondents who have done sex work (72%), those who have experienced homelessness (65%), and people with disabilities (61%) were more likely to have been sexually assaulted in their lifetime. (Transequality)
- 13% of transgender youth report experiencing sexual assault in K-12 settings by their peers or educational staff because of their gender identity. (Transequality)
- 13% of Black transgender people face sexual assault in the workplace. (Transequality)
- Statistics on rape show that professionals in “helping roles” often sexually assault transgender individuals. With 15% of them reporting sexual abuse while in police custody or jail, 5 to 9% reporting being sexually assaulted by police officers, and 10% by healthcare staff. (AVP, Transequality)
- Bisexual women have a significantly higher lifetime prevalence of rape by any perpetrator (46.1%) compared to 17.4% of heterosexual women and 13.1% of lesbian women. (CDC)
- 99.1% of heterosexual women and 98.3% of bisexual women who faced rape report only male perpetrators. (CDC)
- The majority of heterosexual (94.7%), bisexual (87.5%), and lesbian women (85.2%) survivors of sexual violence other than rape report having only male perpetrators. (CDC)
- The majority of gay (78.6%) and bisexual men (65.8%) survivors of sexual violence other than rape report having only male perpetrators. (CDC)
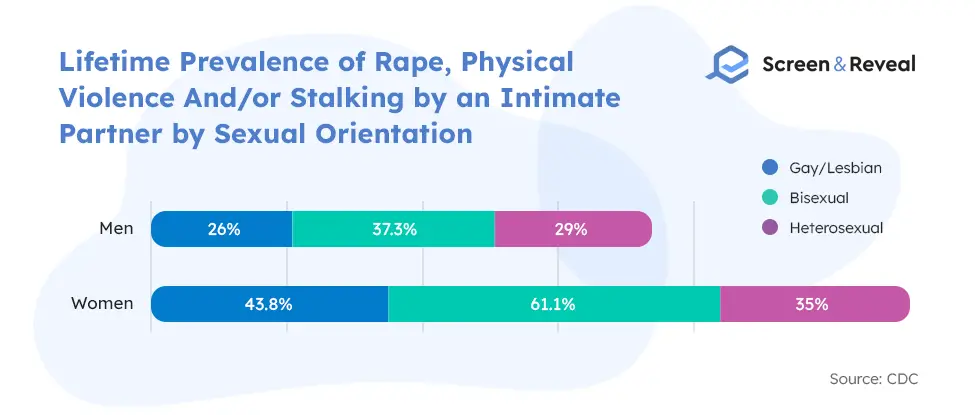
- LGBT sexual assault statistics show that bisexual women have the highest lifetime prevalence of rape, 61.1%. (CDC)
- Nearly half of bisexual women (approx. 1.5 million bisexual women), one in six heterosexual women (approx. 19 million heterosexual women), and one in eight lesbian women (approx. 214,000 lesbians) have experienced rape. (CDC)
- Four out of 10 gay men (40.2%), half of the bisexual men (47.4%), and one in five heterosexual men (20.8%) have experienced sexual violence other than rape. (CDC)
- One in four gay men (26%), four in 10 bisexual men (29%), and one in four heterosexual men report facing rape, physical violence, and/or stalking by an intimate partner. (CDC)
- Statistics of rape show that 91% of bisexual rape victims faced the incident when they were younger than 25 years. (CDC)
- Transgender sexual assault statistics unveil that 6% of transgender people report being sexually assaulted by a coworker for being transgender or gender non-conforming, with a prevalence of sexual assault reaching 19% among undocumented noncitizens. (CDC)
- 41% of LGBTQ individuals say an intimate partner forced them to have sex, and 10% have a partner who forced them to have sex with another person. (NSVRC)
- The reported prevalence of child sexual abuse ranges from 15% to 76% for lesbian or bisexual women and 4% to 59% for gay or bisexual men. (NSVRC)
- The reported prevalence of adult sexual assault ranges from 11% to 53% for lesbian or bisexual women and 11% to 45% for gay or bisexual men. (NSVRC)
- LGBT sexual assault statistics suggest that the reported prevalence of sexual assault by intimate partners ranges from 2% to 45% for lesbian and bisexual women and from 10% to 57% for gay or bisexual men. (NSVRC)
- The reported prevalence of sexual assault as a hate crime ranges from 1% to 12% for lesbian and bisexual women and 3% to 12% for gay and bisexual men. (NSVRC)
- The reported prevalence of lifetime sexual assault is higher among LGBT individuals, with 16% to 85% for lesbian and bisexual women compared to 11% to 17% for females of the general population, and 12% to 54% for gay and bisexual men compared to 2% to 3% for males of the general population. (NSVRC)
5. Rape Statistics by Country
The country with the highest rape rate is Botswana recording 92.93 cases of rape per 100,000 citizens, followed by Australia with 91.92, and Lesotho 82.68. The countries with the lowest rape statistics include Liechtenstein with 0 per 100,000, Egypt with 0.11, and Azerbaijan with 0.17.
(World Population Review)
5.1. Rape Statistics Worldwide
Rape and sexual assault are not exclusive to underdeveloped, third-world countries. Still, those victims are more likely never to receive the protection and support they deserve and need to come to terms with the horrendous experience. In some countries like South Africa, sexual entitlement is deeply embedded in the culture, and offenders often get away with little to no punishment. In other parts of the world, extreme cultural opinions go that far to suggest that if a woman is raped, she should marry her rapist. Below you can find the most notable statistics from around the world.
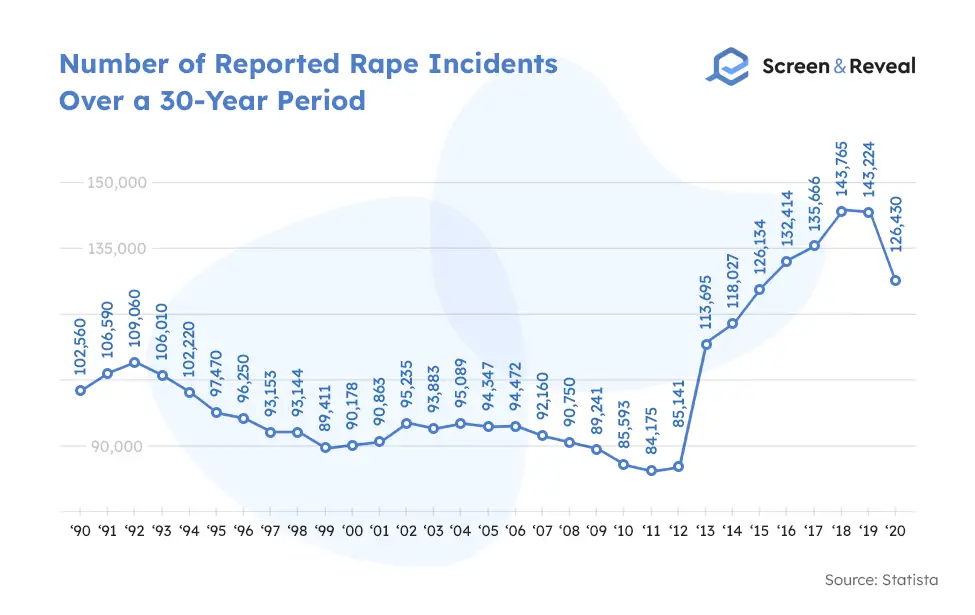
- According to rape statistics, the US police received 98,213 forcible rape reports in 2019, down from 102,560 in 1990. (Statista)
- Between 1990 and 2019 in the US, the most rape cases were reported in 1992 (109,060), while the lowest number of rape cases (82,109) was reported in 2013. (Statista)
- There was a 27% increase in rape and sexual assault victimizations between 2015 and 2018 and a 15% decrease between 2015 and 2019 in the US. (BJS)
- Rape costs the US approximately $127 billion (excluding costs related to child sexual abuse) every year, more than any other crime. (End Sexual Violence)
- With a rape rate of nearly 64 per 100,000 people, Sweden is among the top 10 countries with the highest rape rates globally(World Population Review)
- Sweden rape statistics point to 10,455 cases of sexual molestation and 8,581 cases of rape reported to the local police in 2019, up from 7,904 cases of sexual molestation and 5,960 cases of rape in 2010. (Statista)
- Incarceration statistics show that between 2000 and 2015, a total of 3,039 offenders (majority of them men) were convicted of raping women, with half of them born outside of Sweden, followed by Swedish-born perpetrators with Swedish-born parents. (Taylor & Francis Online)
- Although India has a rape rate of 1.80 per 100,000, it’s considered one of the most dangerous countries for women, with many non-reported rape cases due to victim shaming, social stigmatization, and an ineffective justice system that sometimes takes decades to resolve cases. (Statista)
- India rape statistics show that in 2019, there were 32,032 reported rape cases, up from 18,359 in 2005. (Statista)
- India recorded the highest number of reported rape cases in 2016 when 38,947 rapes were reported. (Statista)
- Germany has a rape rate of 9.4 per 100,000, up from 8.7 in 2015 but down from 10.9 in 2004. (World Population Review)
- Germany rape statistics show there were 9,752 rape cases recorded by the German police in 2020, up from 7,292 in 2008. (Statista)
- The highest number of rape cases in Germany between 2008 and 2020 was reported in 2017, 11,282. (Statista)
- Germany records excellent success in the clearance rates for sexual crimes — in 2019, 84.5% of rape and sexual assault cases were solved, up from 78.6% in 2016. (Statista)
- Among male rape and sexual assault perpetrators in Germany, almost 60% are aged 18 to 21. (Statista)
- Norway has a rape rate of 19.20 per 100,000 people. (World Population Review)
- Norway rape statistics show that between 2015, and 2020, the number of reported rape cases went from 1,286 to 1,756. (Statista)
- There were 773,000 victims ranging from 16 to 74 years who have experienced different forms of sexual assault in the UK in 2020, with almost four times more female victims (618,000) than male victims (155,000). (ONS)
- UK rape statistics show that since 2013, rape offenses in the UK have increased dramatically, going from 18,400 cases in 2012 to 62,200 in 2020, partially due to better reporting practices enforced by police that encourage victims to expose their offenders. (Statista)
- In 2020, the police in England and Wales recorded a total of 162,936 cases of sexual assault. (ONS)
- According to rape statistics, Japan has a rape rate of one per 100,000 people, a drastic decline from two per 100,000 in 2003. (Knoema)
- Australia has a rape rate of 28.60 per 100,000 people, while the overall sexual assault victimization rate is 106 per 100,000 people. (World Population Review, ABS)
- In 2020 there were a total of 27,505 victims of sexual assault in Australia, out of which 84% (23,153) were female. (ABS)
- Australia rape statistics show that almost two million adults have experienced some form of sexual assault since they were 15. (AIHW)
- Denmark has a rape rate of 6.37 per 100,000 people, a dramatic fall from 18.5 in 2015. (World Population Review, Knoema)
- Out of 444,000 crimes reported to the Danish police in 2020, 7,294 were sexual crimes, and the majority of the victims were female. (Statista)
- Denmark rape statistics show that the number of reported sex crimes in Denmark almost tripled between 2010 and 2020, going from 2,642 in 2010 to 7,294 in 2020. (Statista)
- With 132 rape victims per 100,000 people, South Africa is the country with the highest rape rate globally, yet most rape and sexual abuse cases remain unreported. (World Population Review)
- South African police estimate that only one in 36 rape cases gets reported, and only 15 of those lead to a conviction. (Tears)
- Interpol named South Africa the “Rape Capital of the World” as South Africa rape statistics show that every 25 seconds, someone in this country is raped or sexually abused. (Tears)
- There has been a 400% increase in sexual violence against children below 12 years old in South Africa, where many perpetrators are also children. (Tears)
- 28% to 30% of South African adolescents admit their first sexual encounter was forced. (Tears)
- Congo is proclaimed as one of the worst places on Earth to be a woman, partially due to the strong rape culture — Congo rape statistics reveal that every day approximately 1,152 women are raped, which translates to 48 women being raped every hour. (AJPH)
- 12% of Congolese women have been raped at least once in their lifetime. (Women’s Media Center)
5.2. World Rape Statistics
Who is most at risk of rape and sexual assault, and who is most often the offender? These statistics provide a big-picture view on the prevalence of sexual abuse worldwide and unveil the ugly reality that millions of people, the majority of them women, face every day — living with their rapists.
- Men comprise the vast majority of perpetrators in intimate partner and sexual violence cases against women. (WHO)
- Domestic violence statistics show that over a quarter of women worldwide aged 15 to 49 have experienced physical or sexual violence by an intimate partner at least once in their life. (WHO)
- 15 million adolescent girls aged 15 to 19 years globally have faced forced sexual intercourse or other sexual acts by a current or ex-partner. Yet, only one percent have asked for professional help regarding the troubling experience. (UNICEF)
- Rape statistics worldwide show that 6% of women report experiencing sexual assault by a non-partner. (WHO)
- One in 10 women globally has experienced some form of sexual abuse since the age of 15. (FRA)
- One in 20 women globally has been raped since the age of 15. (FRA)
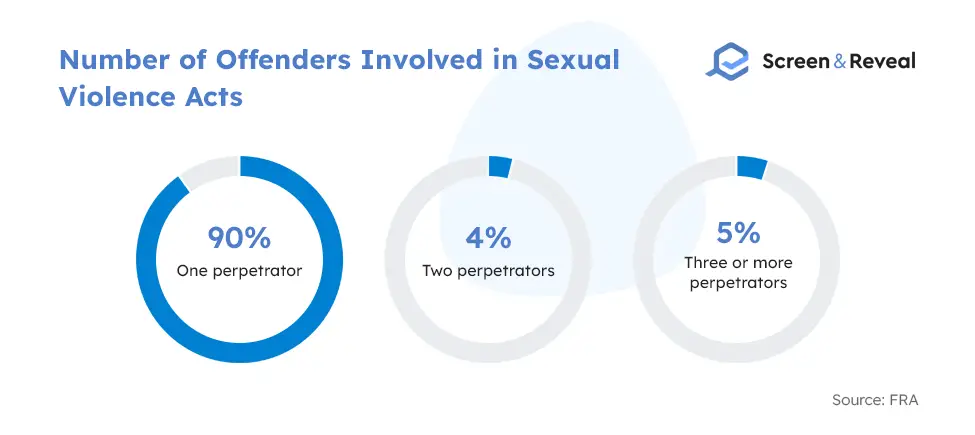
- Of all women in the EU who have been victims of non-partner sexual violence, almost one in 10 shares that more than one offender was involved in the most severe sexual abuse incident they’ve experienced. (FRA)
- In 90% of the sexual violence cases in the EU, one offender was involved. (FRA)
- World rape statistics show that women who have faced sexual abuse are 1.5 times more likely to have a sexually transmitted infection, HIV in some parts of the world, and twice as likely to have an abortion than women who haven’t experienced intimate partner violence. (WHO)
- Adult women and girls comprise 72% of human trafficking victims globally, out of which 49% are adult women, and the vast majority of them are sexually exploited. (UNODC)
- Girls account for more than three of every four child trafficking victims globally. (UNODC)
- Sexual assault statistics show that only 14% of women in the EU reported the most severe violent incident to the police by an intimate partner, and only 13% have reported the most severe violent incident perpetrated by a non-partner. (FRA)
- Among EU countries, there are 11 reported rape cases per 100,000 people per year. The suspected perpetrator is found in five cases per 100,000 people, and two offenders per 100,000 people are convicted. (FRA)
- 40 to 60% of women in the Middle East and North Africa have been subject to street sexual harassment, receiving inappropriate sexual comments, or have been stalked or followed. 31% to 64% of men admitted they performed such acts against women, with younger men, men who have experienced violence as children, and men with more education being more likely to engage in street-based sexual harassment. (imagesmena.org)
6. Date Rape Statistics
Date rape falls under acquaintance rape, where non-consensual sexual intercourse occurs between people in a romantic relationship or even people hanging out together, for example, at a party.
- The prevalence of date rape is the highest among adolescents, with a 20% to 68% lifetime prevalence of date or acquaintance rape. (PubMed)
- The lifetime prevalence of date or acquaintance rape among college-age women is 13% to 27%, according to date rape statistics. (PubMed)
- Demographic characteristics that increase the risk of date rape include a history of sexual abuse, prior sexual victimization, having a first date at a younger age, earlier menstruation, and accepting violence against women or rape myths. (PubMed)
- Date-specific factors like who initiated the meeting, who paid the expenses, who drove, location of the date, activity, alcohol, and drug use can significantly increase the probability of date rape. (PubMed)
- GHB, Rohypnol, and ketamine are the most popular date-rape drugs. (IDPH)
7. Pregnancy From Rape Statistics
Often, offenders don’t use any protection when committing sexual assault against women, exposing them to dangerous sexually transmitted diseases and unwanted pregnancy.
- The rape-related pregnancy rate is 5% among rape victims in reproductive age 12 to 45, resulting in 32,101 rape-related pregnancies in the US annually. (PubMed)
- Almost three million American women have experienced rape-related pregnancy in their life. (CDC)
- Most rape-related pregnancies occur among adolescents, and the perpetrator is often known or related to the victim. (PubMed)
- Pregnancy from rape statistics suggest that women raped by a current or ex intimate are more likely to report rape-related pregnancy (26%) than those raped by a stranger (6.9%) or acquaintance (5.2%). (CDC)
- Among cases of rape-related pregnancies, data suggests that 32.4% of the victims don’t realize they are pregnant until they enter the second trimester. (PubMed)
- Only 11.7% of rape-related pregnancy victims have received immediate medical attention after the event, while 47.1% received no medical help related to the rape. (PubMed)
7.1. Abortion Due to Rape Statistics
Pregnancy as a result of rape is a severely traumatic experience. Hence the majority of victims opt to abort.
- Victims of sexual abuse by an intimate partner are twice as likely to have an abortion than women who haven’t experienced intimate partner violence. (WHO)
- 50% of victims who get pregnant due to rape choose to abort, and 11.8% have a spontaneous abortion. (PubMed)
- Approximately 13,000 women decide to abort each year because they got pregnant due to rape or incest. (National Abortion Federation)
8. College Sexual Assault Statistics
Data shows that college-age women are at the highest risk of sexual assault and rape. The data shown below allows you to dive deeper into the details of sexual abuse among young women.
- Whether they are attending college or not, college-age women 18 to 24 years old have the highest rape and sexual assault rates than women of all other generations, with 4.3 victimizations per 1,000, compared to 1.4 victimizations for other age groups. (BJS)
- Male students have a rate of 1.4 victimizations per 1,000 students, while among male non-students, this rate is even lower — 0.3 per 1,000. (BJS)
- Male rape statistics show that male students and non-students aged 18 to 24 years experience significantly lower rape and sexual assault incidents than females, with college-age male victims comprising 17% of all rape and sexual victimizations against students in the US. College-age non-students account for 4% of all incidents. (BJS)
- Only 20% of rape and sexual assault student survivors report the crime, compared to 32% of non-student survivors ages 18 to 24. (BJS)
- 80% of student rape and sexual assault survivors and 67% of non-student rape and sexual assault survivors don’t report the cases to the police, with 12% of student victims and 5% of non-student victims stating the incident wasn’t significant enough to report. (BJS)
- Rape statistics suggest that the perpetrator was known to the victim for both college students and non-students of the same age group in about 80% of rape and sexual assault cases. (BJS)
- Most student rape and sexual assault crimes happened while the victim was engaging in leisure activities away from home, which is not the case with non-students, where most cases occur at home. (BJS)
- The perpetrator had some type of weapon in one in 10 rape and sexual assault victimizations against students and non-students 18 to 24 years old. (BJS)
- Sexual assault statistics show that 16% of student victims and 18% of non-student victims of sexual assault and rape received some form of assistance from a victim services agency. (BJS)
- 57% of student sexual victims and 63% of non-student college-age sexual victims have been injured during the forced sexual act, yet only four in ten (40%) of those injured received medical help for their injuries. (BJS)
- In 97% of female student victimizations and 91% of female non-student victimizations, the offender was male, and in half of the cases, the offender was white. (BJS)
8.1. Sexual Assault on College Campuses Statistics
Sexual abuse is unfortunately quite prevalent on campuses, and offenders often get away unpunished because most victims never report the abuse. Statistics indicate that educational institutions must do better work to prevent and respond to sexual violence on campuses.
- One in five women and one in 16 men are sexually assaulted while in college. (OJP)
- The overall rate of forced or non-consensual sexual contact among college students was 13% since they enrolled in college. (AAU)
- The rape and sexual assault rate among undergraduate women ranges between 14% and 32%. (AAU)
- 84% of female sexual assault survivors have been victimized during the first four semesters, known as the “red zone” on campus. (OJP)
- College sexual assault statistics unveil that 59.2% of undergraduate women students report experiencing harassing behavior, 14.1% face intimate partner violence, and 10% experience stalking. TGQN (transgender, queer, nonbinary) women report similar rates, with 65.1% having experienced harassment, 21.5% intimate partner violence, and 15.2% stalking since college enrollment. (AAU)
- Among undergraduate women, 7.3% have experienced penetration by physical force, and a bit less, 5.4%, by the inability to consent. (AAU)
- 92% of undergraduate women and TGQN students report at least one behavioral or emotional consequence of sexual victimization. (AAU)
- 41.8% of all students report experiencing at least one type of sexual harassment since college enrollment. These experiences often “interfered with their academic or professional performance,” “limited their ability to participate in an academic program,” or “created an intimidating, hostile or offensive social, academic or work environment.” (AAU)
- According to sexual assault on college campuses statistics, 24% of graduate and professional women and 5.5% of undergraduate women experience sexual harassment by a faculty member or instructor, compared to 18.2% of graduate men and 4.3% of undergraduate men. (AAU)
- On average, 10.1% of all students who have been in a romantic relationship since entering college have experienced intimate partner violence, and 5.8% have experienced stalking. (AAU)
- Fraternity rape statistics show over a quarter of incapacitated sexual assault college victims (28%) say their offender was a fraternity member compared to 14% of physically forced sexual assault victims. (OJP)
- Fraternity college members are more likely to commit a sexual assault or show sexual aggression than nonfraternity individuals. (OJP)
- College women who frequently attend fraternity parties are more likely to become a subject of AOD (alcohol and/or another drug)-enabled sexual assault or intimate partner violence. (OJP)
9. Uber Rape Statistics
No data indicate that Uber is a more dangerous form of transportation than similar companies. The release of the Uber 2017/2018 US safety report shows the company’s dedication to continuously improving safety practices. As a company that serves a society where sexual assault is prevalent, it’s understandable that Uber can’t be immune to such incidents.
- People took 2.3 billion Uber rides over these two years, and no safety incident was reported in 99.9% of those trips. (Uber)
- Uber’s 2017/2018 US Safety Report reveals that the company received 5,981 reports of sexual assault over the two years, with 2,936 reports in 2017 and 3,045 reports in 2018. (Uber)
- Over this period, Uber received a total of 464 rape reports, the most severe form of sexual assault. (Uber)
- Uber rape statistics show that drivers reported assault at almost the same rate as riders across the five categories of sexual assault the company examined. In these categories, riders accounted for 45% or nearly half of the accused parties. (Uber)
- Non-consensual kissing of a non-sexual body part was reported in about one in every 2,000,000 completed trips. (Uber)
- Instances of non-consensual kissing of a sexual body part were reported in one in every 3,000,000 completed US trips. (Uber)
- Non-consensual touching of a sexual body part was reported in about one in every 800,000 rides. (Uber)
- Uber drivers or riders report experiencing an attempted non-consensual sexual penetration in about one in 4,000,000 completed trips. (Uber)
- The most severe form of sexual assault — non-consensual sexual penetration — was reported in about one in 5,000,000 US trips. (Uber)
10. Prison Rape Statistics
While there’s no doubt that offenders should be punished for their violations of law, the stay in prison should never come with sexual abuse, yet quite often, it does. Both inmates and prison staff can get in the role of perpetrators. Prison rape victims are extremely unprotected, especially if the abuse comes from staff members.
- In 2015, correctional administrators reported 24,661 allegations of sexual assault in adult correctional facilities, including prisons and jails, a nearly triple rise from 8,768 in 2011, indicating that initiatives to prevent, detect and respond to prison rape are encouraging more victims to report the crime. (BJS)
- Of all the reported allegations, 1,473 cases were substantiated, and of those, 58% were perpetrated by inmates and 42% by correctional facility staff members. (BJS)
- According to rape reporting statistics, reports on staff-on-inmate sexual misconduct increased more than inmate-on-inmate sexual victimization reports, accounting for 63% of the total increase. (BJS)
- Between 2011 and 2015, allegations of staff-on-inmate sexual misconduct jumped from 2,800 in 2011 to 8,151 in 2015, a 191% increase in only a few years. (BJS)
- The number of sexual allegations in prisons was up 180% in 2015, going from 6,660 cases in 2011 to 18,666 in 2015. (BJS)
- The number of sexual allegations in jails increased at a similar rate (up 184%), from 2,047 in 2011 to 5,809 in 2015. (BJS)
- Of the 67,168 allegations of sexual assault reported between 2012 and 2015, authorities completed the investigations for 61,316 cases, out of which 5,187 (8%) were substantiated. (BJS)
- When it comes to inmate-on-inmate sexual harassment allegations, prison rape statistics show that of the total 15,875, 2,426 (16%) were substantiated. (BJS)
- Of the total 24,661 sexual misconduct allegations in 2015, 1,473 (6%) were substantiated, and 2,733 (11%) were under investigation. (BJS)
- There were 10,142 unfounded and 10,313 unsubstantiated sexual abuse allegations in 2015. (BJS)
- The inmate-on-inmate sexual harassment rate of allegations was 2.2 per 1,000 inmates in prisons and 2.5 per 1,000 inmates in jails during the three years between 2013 and 2015. (BJS)
- The rate of substantiated cases of inmate-on-inmate sexual harassment was 0.3 per 1,000 inmates in prisons and 0.5 per 1,000 inmates in jails. (BJS)
11. Sexual Assault in the Military Statistics
The military isn’t immune from sexual abuse either, receiving thousands of reports for sexual abuse every year. Quite disturbingly, previous data shows that sexual assault is a highly underreported crime in the military mainly because victims don’t have faith in the system.
- In 2020, the Department of Defense received 7,816 sexual assault reports, almost the same as in 2019 when 7,825 reports were made. (SAPR)
- Out of the total 7,816 reports, the military department received 6,290 reports by service members for incidents during their military services, a 1% increase from 6,236 reports in 2019 but a drastic increase from 2,828 in 2012. (SAPR)
- According to rape statistics, the US Department of Defense also received 912 reports for US civilians and foreigners for alleged sexual assault by service members. (SAPR)
- In the fiscal year 2018, of all women in the military who reported a non-consensual penetrative sexual assault, 59% faced mistreatment from someone with a higher rank, and 24% were assaulted by a person in their chain of command. (Protect Our Defenders)
- The fiscal year 2018 report estimates that 76.1% of victims don’t report the assaults, and a third of the victims get discharged typically within seven months of reporting. (Protect Our Defenders)
- Sexual assault in the military statistics suggest that victims of sexual assault usually receive harsher discharges, with 24% of them getting separated under less than fully honorable conditions, compared to an average of 15% for all military service members. (Protect Our Defenders)
- Military sexual assault often goes unreported because victims don’t trust the system — one in four fear retaliation from their command or coworkers, one in three doesn’t believe the process would be fair. Fewer than half of the female victims meanwhile felt supported by their chain of command. (Protect Our Defenders)
- According to sexual assault in the military statistics, approximately 38% of female and 4% of male military staff members and veterans have experienced military sexual trauma (MTS). (PubMed)
- Veterans with military sexual trauma are twice as likely to face homelessness. (PubMed)
- The presence of sexual harassment among military service members is alarmingly high, with 24.2% of women and 6.3% of men on active duty being subject to sexual harassment in 2018. (Politico)
- One in five females in the military who were sexually harassed also experienced sexual assault. In general, service members who are sexually harassed are more likely to get sexually assaulted. (Protect Our Defenders)
- More than one in four service members who experience sexual assault, harassment, or career-harming gender discrimination decide to leave the military as a result. (Protect Our Defenders)
12. Sexual Assault Reporting Statistics
Sexual assault is among the most underreported crimes due to a complex range of reasons. Often, victims have been heavily traumatized and afraid that they don’t dare to share the experience. In other instances, victims don’t trust the system, blame themselves, or feel too ashamed. Those in charge must create a safe environment for victims and offer solid support and protection to encourage more survivors to report their offenders.
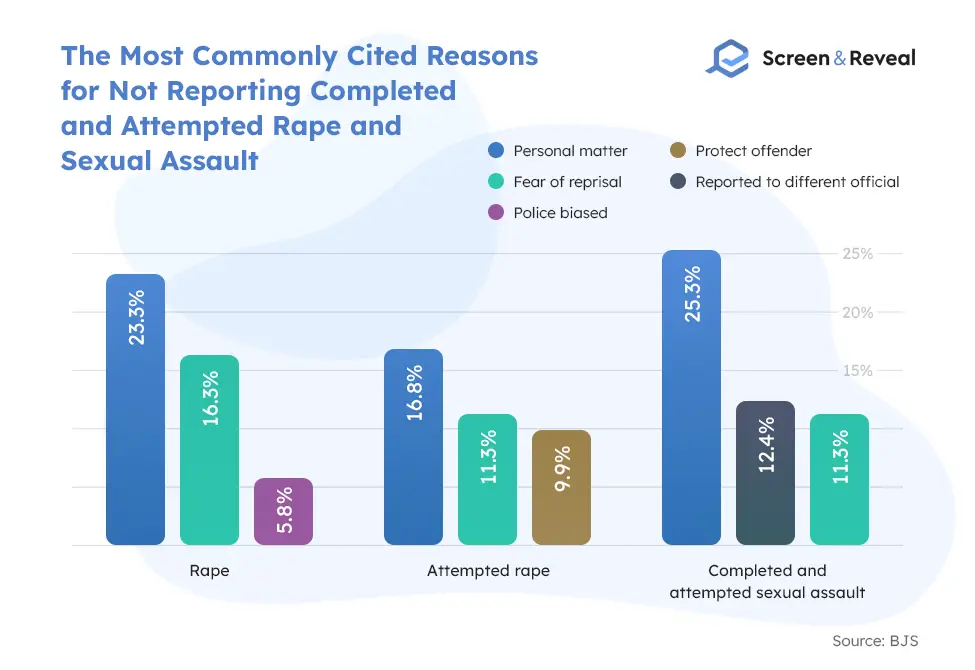
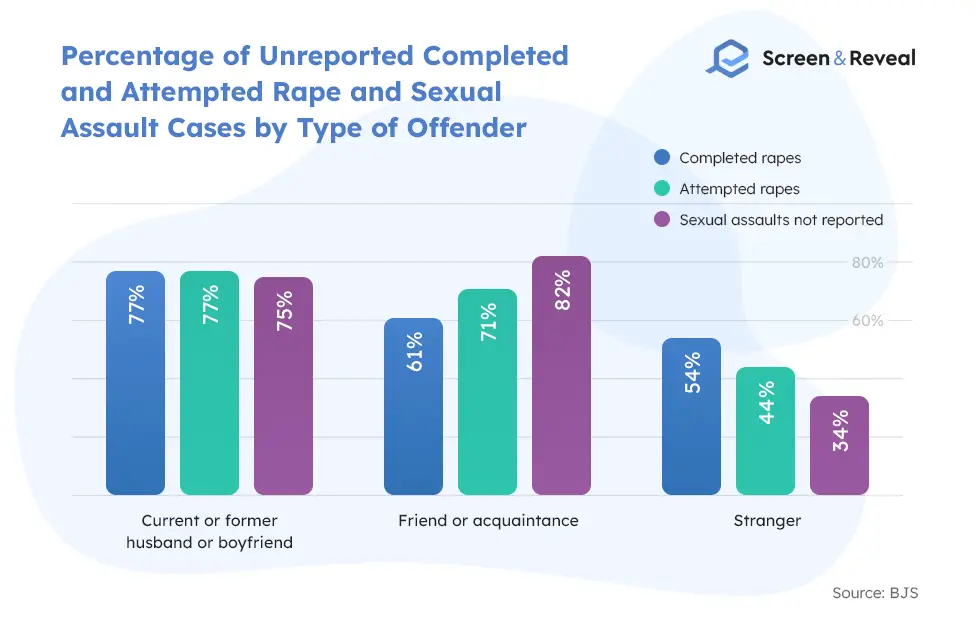
- Sexual assault is one of the most underreported crimes in the US, with 63% of unreported cases. More precisely, unreported rape statistics indicate that 74% of attempted and completed sexual assaults, 65% of attempted rapes, 63% of completed rapes against women were not reported to the police. (BJS)
- Personal matter is the most common reason victims of attempted rape, completed rape, and completed and attempted sexual assault don’t report the cases. (BJS)
- According to unreported rape statistics, the closer the relationship between the female victim and her offender, the less likely she’ll report the sexual assault or rape. (BJS)
13. Acquaintance Rape Statistics
The story of an unknown pervert coming out of the dark and sexually abusing a random person is less common than you think. In the vast majority of sexual assault cases, the perpetrator is someone known to the victim. The following statistics dive deeper into the prevalence of acquaintance rape versus rape by other perpetrators.
- The majority of sexual assault women survivors report experiencing these acts from perpetrators they know. (NSVRC)
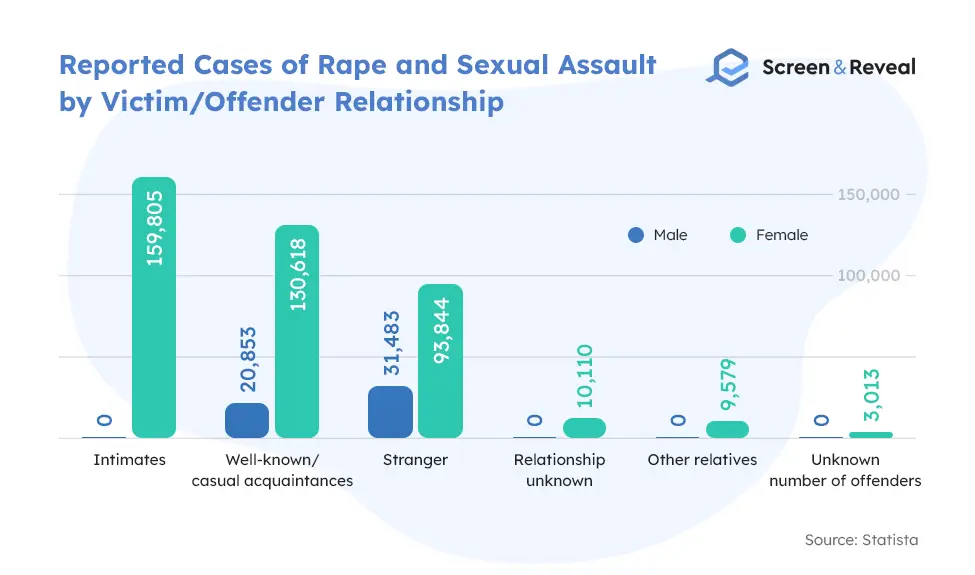
- In 2019, 159,805 US women were raped or sexually assaulted by an intimate partner, while the number of male intimate partner rape and sexual assault victims is zero. (Statista)
- According to acquaintance rape statistics, 130,618 US women were raped or sexually assaulted by well-known or casual acquaintances, compared to 31,483 males who experienced the same in 2019. (Statista)
- Rape-related pregnancy by an acquaintance occurs in 5.2% of cases. (CDC)
- Reported cases of sexual assault against juveniles indicate that 93% of them knew their offenders, with 59% of offenders being acquaintances, 34% family members, and only 7% strangers. (BJS)
14. Marital Rape Statistics
Marital rape refers to the sexual violence from one spouse against another. Marital rape was not recognized as a crime until late in US history. Until the 1970s, rape laws in every state in the nation treated marital rape as an exception if the victim and the offender were husband and wife. Finally, in 1993, each one of the 50 states eliminated the marital rape exception. Yet, it remains one of the most troubling forms of sexual abuse where victims live with their rapists and face repeated abuse, along with other forms of violence.
- One in 10 women (between 10% and 14%) experience marital rape at some point in their lifetime. (NCADV)
- Spousal rape is four times more common than stranger rape. (NCDSV)
- Shocking spousal rape statistics unveil that 18% of women who have experienced marital rape reported that their children had witnessed the sexual assaults, and 5% said their husbands forced the children to participate in the sexual act. (NCDSV)
- Rape by intimate partners accounts for over one-quarter of all rapes. (NCDSV)
- Battered women are at higher risk of marital rape. Between 20% and 30% of those seeking counseling, assistance, or relationship maintenance report being raped at least once by their husbands, a prevalence two to three times higher than that experienced by ever-married women. (NCDSV)
- Marital rape statistics showcase that nearly half or even 70% of all battered women have faced sexual assault by their intimate partners. (NCDSV)
- 36% of victims who reported wife rape feared they would die during the assaults. (NCDSV)
- Approximately 35% of marital rape survivors report they were beaten during forced sexual intercourse. (NCDSV)
- Many wife rape cases have occurred during a woman’s illness or immediately after discharge from a hospital, often after childbirth. Many marital rape survivors also report increased sexual violence during pregnancy. (NCDSV)
- There’s an increased risk of spousal rape shortly prior, during, or after a separation or divorce, as nearly a quarter of women report experiencing sexual assaults in those instances. (NCDSV)
- One-quarter to two-thirds of rape victims have experienced multiple rapes during and after their relationship with the offenders. (NCDSV)
15. Gang Rape Statistics
Gang rape refers to the rape of one person by a group of people, or at least two offenders, but typically more. While a small portion of all rape cases in the US is gang rape incidents, the victims usually end up with severe injuries and emotional trauma.
- Approximately 10% of rapes involve two or more offenders. (BJS)
- Both gang rape victims and offenders tend to be younger and often unemployed. If reported, the offenders will end up with a lifelong record that criminal background check companies will report indefinitely to employers, making it even harder for them to ever find a stable job.(PubMed)
- Gang rape statistics indicate that alcohol and drug involvement is more prevalent in gang rape. Victims usually show less resistance, fewer offenders use weapons, the attack in most instances occurs at night, and the outcomes are far more severe compared to individual rapes. (PubMed)
- Gang rape victims report the troubling assaults to law enforcement authorities, including police, mental health, and medical sources, more often than single-offender sexual assault victims. They also receive more negative social reactions from people they told about the sexual assaults. (PubMed)
- 3,013 US female victims couldn’t provide information on how many perpetrators were involved in the troubling event in 2019. (Statista)
16. Statutory Rape Statistics
Statutory rape defines sexual contact with a person younger than the statutory age of consent. Sexual contact is consensual by both sides, but because one side is below the age of consent defined by law, the act is considered illegal, although many states no longer refer to this crime as statutory rape. The “age of consent” may vary by state, but it’s usually 16, 17, or 18 years old. The offender can also be a juvenile or adult. Unfortunately, there isn’t much data available on statutory rape as many law enforcement authorities don’t run separate statistics on statutory rape.
- Rape statistics show that 95% of statutory rape victims are female. (OJP)
- More than 99% of perpetrators of female statutory rape are male, compared to 6% of perpetrators of male statutory rape. (OJP)
- 18% of female statutory rape offenders and 12% of offenders of male statutory rape are younger than 18. (OJP)
- According to female sex offender statistics, 94% of offenders of male statutory rape are women. (OJP)
- In 90% of statutory rape incidents, one offender is involved. (OJP)
- Of all perpetrators of male statutory rape, 70% were age 21 or older, compared to 45% of perpetrators of female statutory rape. (OJP)
- Statutory rape statistics show that no matter the gender, three out of five statutory rape victims were age 14 or 15. (OJP)
- The median age difference between male perpetrators and their female statutory rape victims is nine years. (OJP)
- The median age difference between female perpetrators and their male statutory rape victims is six years. (OJP)
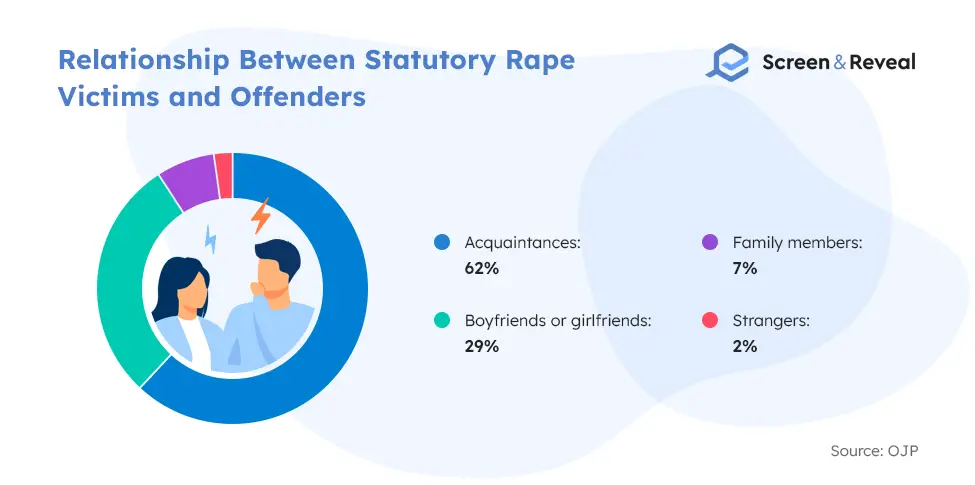
- Data shows that three out of 10 statutory rape perpetrators (29%) were boyfriends or girlfriends of the victims. (OJP)
- Statistics about sexual assault show that 42% of statutory rape offenders got arrested for their illegal acts, but the probability of an arrest decreases as the victim’s age increases. Some reports never result in an arrest due to a lack of cooperation from the victim’s side. (OJP)
- 85% of statutory rape incidents occur in residence. (OJP)
- The majority of statutory rape incidents involve offenders and victims of the opposite sex. (OJP)
17. Catholic Priest Rape Statistics
Multiple scandals throughout the years have shown that the Catholic Church is not always a safe place for children. Over the last several decades, thousands of victims have accused Catholic priests, clergy, and other Church members in positions of trust for various forms of sexual abuse. Pedophile statistics show that the number of allegations for sexual abuse against minors quadrupled in 2019 due to the new compensation programs offered by the Catholic Church as a way to provide support to survivors abused by its members.
- Between 2018 and 2019, there were 4,434 sexual abuse cases by clergy allegations reported by 4,220 child victims across 194 Catholic dioceses and eparchies for abuses that have occurred from the 1940s to the present. (USCCB)
- Only a year earlier, in 2018, there were significantly fewer reports — 1,451 by 1,381 victims of clergy sexual abuse, which was still higher than 903 reports by 838 victims in 2015. (USCCB)
- Catholic priest rape statistics show that out of all allegations the dioceses and eparchies have received between 2018 and 2019, 2,237 are considered new credible allegations that meet the threshold for credibility. (USCCB)
- These 2,237 new credible sexual abuse allegations were made against 1,391 priests or deacons, a 159% increase in allegations, 161% increase in victims, and 219% increase in offenders reported compared to the 2017 to 2018 period. (USCCB)
- Of all 2,237 allegations, 1,770 victims (80%) were male, and 453 victims (20%) were female, while for 14, the gender wasn’t identified. (USCCB)
- According to Catholic priest statistics on rape, 22% of allegations involved victims nine or younger, 59% affected victims aged 10 to 14, and 19% involved victims aged 15 to 17. (USCCB)
- For the allegations made between 2018 and 2019, 57% of them have occurred before 1975, 41% have occurred between 1975 and 1999, for 5% a time frame could not be defined, and 2% happened since 2000, with the periods between 1970 and 1974, and 1975 and 1979 receiving the most allegations 355, and 299 respectively. (USCCB)
- Out of the 4,434 allegations of sexual abuse in 2019, 1,434 are unable to be proven, 1,034 are substantiated, for 956, the investigation is still ongoing, 863 have another status, and 147 are unsubstantiated. (USCCB)
- Of all 4,434 allegations, 37 involved current-year minors. (USCCB)
- Catholic sexual assault statistics suggest most sexual abuse by Catholic priest allegations are perpetrated by adults who were abused as minors. (USCCB)
- The number of accused clerks between 2018 and 2019 totaled 2,982, out of which 2,623 were priests. (USCCB)
Conclusion
While sexual assault statistics are disturbing, raising awareness about one of the most common forms of crime in the US and worldwide could help victims speak up more often than they do now. Gaining a more comprehensive perspective about the magnitude of the problem meanwhile could result in more and better prevention programs, ultimately helping bring down the cases of sexual assault.
Sources: PubMed, FBI UCR, NSVRC, NSVRC, Statista, Transequality, Transequality, AVP, CDC, NSVRC, World Population Review, Statista, BJS, End Sexual Violence, Statista, Taylor & Francis Online, Statista, Statista, Statista, ONS, Statista, ABS, AIHW, Knoema, Statista, Tears, AJPH, Women’s Media Center, WHO, UNICEF, FRA, UNODC, FRA, imagesmena.org, PubMed, IDPH, CDC, PubMed, National Abortion Federation, BJS, OJP, AAU, Uber, BJS, SAPR, Protect Our Defenders, PubMed, PubMed, Politico, BJS, NCADV, NCDSV, BJS, PubMed, OJP, USCCB, NHLC