Customer service is what can make or break a business — if your customers don’t want to interact with you, they are all the more likely to flock to the competition. To make things even more complicated, with the evolution of technology, this field has been changing drastically. Now customers connect with brands through multiple channels, and companies need to adapt quickly. That’s why we prepared these essential customer service statistics to guide you through this crucial aspect of doing business and stay on the good side of your customers.
Customer Service Statistics (Editor’s Choice)
- 95% of consumers claim that customer service is what matters for brand loyalty. (Oberlo)
- 40% of customers used more than three conversation channels to talk with customer support. (Airkit)
- The customer service management market is estimated at $11.34 billion. (Oberlo)
- Poor customer service costs businesses about $75 billion annually. (Bloomfire)
- 62% of customers would recommend a brand to a friend if provided with good service. (Gladly)
- Six out of 10 customers share their bad experiences. (Oberlo)
- By 2025, AI is expected to power 95% of customer interactions. (The Pipeline)
- 90% of retail leaders confirm that a seamless omnichannel strategy is vital. (REVE Chat)
General Customer Service Stats
1. 95% of consumers claim that customer service is what matters for brand loyalty.
Almost all customers said in a recent survey that customer service experience is what impacts the overall brand loyalty. This goes hand in hand with the fact that 60% of people would leave a brand and go to the competition if the customer service was poor. Customer retention, however, is cheaper than acquisition so brands need to work on building strong customer service.
(Oberlo)
2. 76% of people prefer to call customer support.
Although most people today opt for texting, emailing, or similar channels, telephone service is still one of the most common ones. Recent phone customer service stats show that three-quarters or more of consumers prefer this traditional medium via call centers. It’s much more popular than other digital forms of communication with customer service.
(Oberlo)
3. Over 65% of people have higher expectations for customer service now than they had three years ago.
According to several customer service studies, the needs of consumers are evolving, and customer service needs to follow that. To build long-term relationships and loyalty, brands need to work on improving this field. Especially, since millennials now have massive spending power, and want services designed for their needs.
(Zendesk)
4. 58% of customers think that CX is the main differentiator when choosing a brand, or deciding to buy from it.
Over half of surveyed people claim that CX is of the utmost customer service importance, statistics confirm. For many Americans, it is just as important as the portfolio of products or services a company offers.
(Zendesk)
5. 39.9% of surveyed companies believe the main challenge to optimizing customer journeys is the lack of collaboration among departments.
A survey conducted among the US companies in 2021, revealed interesting facts about client service experience and journey. To optimize it there needs to be more collaboration between departments in a company. Namely, most of the respondents dubbed this as the main obstacle. This is important for many reasons but one of the main ones, according to the 48% of organizations is generating customer engagement.
(Locus)
6. Seven out of 10 surveyed customers prefer to talk to a live agent by phone.
Statistics on customer service on the phone confirm one fact. Customers prefer talking to live agents (69%). Further, five out of 10 cited email as their preferred mean of communication (54%), and four in 10 claim it’s an online chat with a human agent (46%).
(Business Wire)
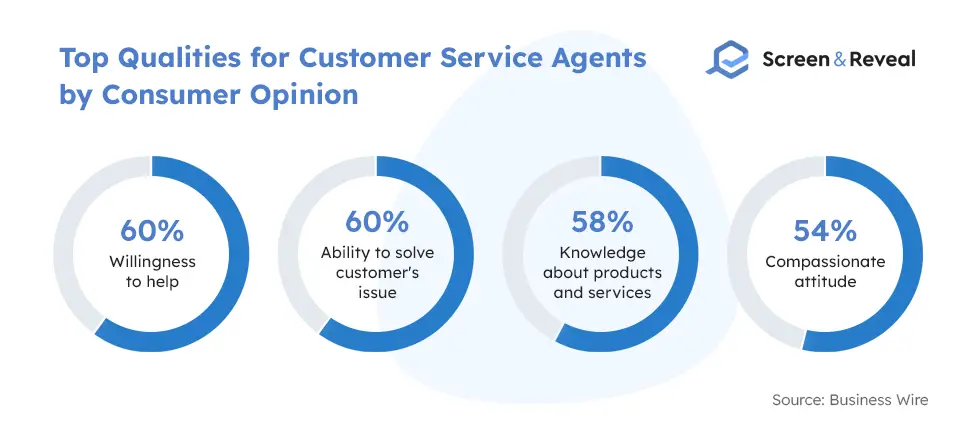
7. 60% of customers pick willingness to help as the number one quality for a customer service agent.
Most customers agree that willingness to help is what separates a good from a bad agent. The ability to solve customer issues (60%) has nearly the same importance, closely followed by knowledge about the services and products (58%). Next, 54% said having a compassionate attitude is what makes a difference. Out of age groups, millennials value a compassionate attitude the most, millennial customer service stats reveal. This compares to only 13% for Baby Boomers.
(Business Wire)
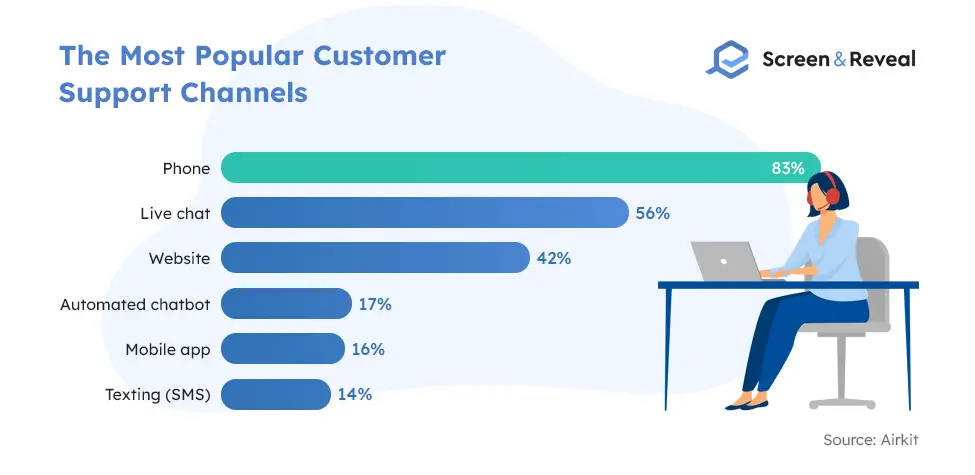
8. 40% of customers used more than three conversation channels to talk with customer support.
Good customer relations often entail covering several channels. Only then, a company can be certain that it will manage to build some sort of relations with its consumers. For starters, it’s important to have support for the three most used ones: phone (83%), live chat (56%), and website inquiry (42%). Other than these, customers often interact with a brand using an automated chatbot (17%), mobile app (16%), or texting (14%).
(Airkit)
Customer Service Industry Statistics
9. The customer service management market is $11.34 billion worth today.
A recent report by Fortune Business Insights shows that the customer service market is growing constantly in the last few years. So, in line with the statistics on customer service, the market increased 12.2% YoY ($10.11 billion in 2021). Moreover, the market is set to grow at a 16.2% CAGR between 2022 and 2029 and hit $32.53 billion. Most of this growth originates in the rising number of companies adopting AI and AR to improve customer experience.
(Oberlo)
10. Poor customer service costs about $75 billion annually.
Besides reputation, there is the financial cost of poor customer service, statistics show. Despite the staggering figure of $75 billion annually, businesses are facing many issues with consumer behavior and demands. All of that results in the loss of money for many organizations that fail to meet the requirements.
(Bloomfire)
11. In 2020, the call center market reached $339.4 billion.
Technological development and the global shift toward the customer experience have boosted this particular industry. Call industry statistics further show that the market is set to hit $496 billion by 2027, with the number of companies with great customer services on the rise.
(Statista)
Stats on Good Customer Service
12. 81% of customers claim that a positive customer experience improves the chances for them to purchase something.
Customer agents are not there only to solve consumer complaints and issues. As a matter of fact, a high level of service often leads to nurturing customers into completing a purchase. Most consumers today believe that customer service is one of the main factors influencing their purchasing. Namely, 70% have actually decided to buy something due to the quality of the customer services, while 78% would go to competitors if they had a bad experience.
(Oberlo)
13. One-third of all customers believe that ability to solve their problems is the most important aspect of good customer service.
Good customer service statistics show that customers prefer to have their issues resolved straight away. If they have to wait more and get in touch with the customer agents once again, they lose patience. Even though many customers also think that knowledgable customer representatives play an important role, 31% still say solving the issue in the first sitting is the characteristic of good customer service.
(Oberlo)
14. 68% of customers are willing to pay up more for services and products from a brand that is known for excellent customer experience.
The importance of customer service lies not only in the good reputation for the brand but in profits as well. Statistics on good customer service show that a company that has good service can afford to raise prices because customers will pay for it nevertheless. Since 46% of consumers are expecting more from customer service every year, there is a chance for brands to leverage this and increase profits.
(Oberlo)
15. 62% of customers would recommend a brand to a friend if provided with good service.
Other than delivering affordable and quality products, brands need to offer customers the service they want. By looking at the statistics on bad vs good customer service, we can conclude that 63% of consumers fall in love with the brand if they get good service. Not to mention, they also share this experience with their friends.
(Gladly)
16. Only a 5% customer retention increase generated about 25% profit growth.
Customers retention generates increased profits for the company. So in financial services, a small increase of 5% in customer retention could boost profits by a quarter. Since return customers have a tendency to purchase more over time. Operating costs, therefore, decrease. Repeat customers further refer your company through reviews, attracting new prospects. Ultimately, they are willing to pay a premium to keep their relationship with the brand they feel comfortable with.
(Bain&Company)
Stats About Bad Customer Service
17. Over six out of 10 customers stop purchasing from a brand if they have just one bad experience.
The effect of poor customer service on all aspects of doing business is tremendous. Even a single poor customer service interaction could cost a company that customer. That strongly emphasized the importance of this vital area in the overall experience a brand wants to present to customers.
(Oberlo)
18. 56% of customers listed automated telephone systems as the most frustrating part of poor customer experience.
Automated telephone systems are the worst issue for over half of customers in case they are not adopted properly. There are many automated telephone systems on the market, but if the company allows easy access to a human agent, it can avoid bad customer service, statistics show. It’s one of the biggest frustrations of the consumer.
(Oberlo)
19. Six out of 10 customers share their bad experiences.
The impacts of bad customer service go beyond a single consumer. Most of them share their negative experience with their peers. Word-of-mouth marketing has the potential to uplift a brand, but it also affects negatively the numbers if the situation is reversed. So, either way, customer service, and reputation could make or break a company.
(Oberlo)
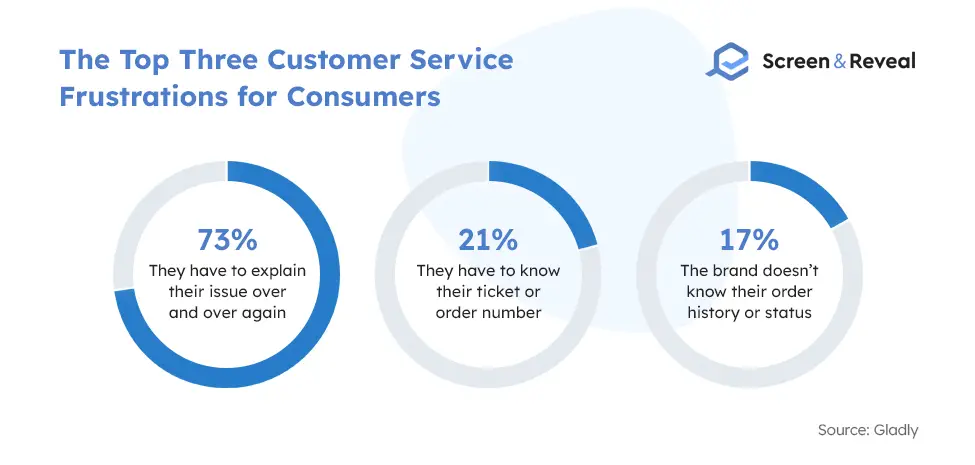
20. 81% of consumers think that customer service is below their needs and expectations.
Stats on bad customer service show that the top issues for customer service revolve around the lack of personalization. Brands need to stop asking customers the questions they already have answers to. Number one frustration for most customers is having to repeat the question all over again (73%), followed by having to know the ticket or order number (21%). Finally, 17% get upset when the brand doesn’t know their order history and data.
(Gladly)
21. 80% of customers would go with a competitor if they had over one bad experience.
A single bad customer experience could be a dealbreaker for 50% of consumers, poor customer service statistics confirm. But the chances are the customer will most probably leave a company after two are pretty high. About 80% of them actually claim they would. Out of all countries where research was conducted, India was the only one with a smaller percentage (60%) of those who would leave after two bad experiences.
(Zendesk)
22. 64% of consumers aren’t able to solve their problem using the company’s customer service.
Typically, customers have to deal with call centers and long waiting times, which results in poor customer service. Companies could solve this issue by utilizing self-service options, like FAQs, help centers, and chatbots.
(Zendesk)
Technology and Online Customer Service Statistics
23. 75% of customers would rather interact with a person.
Despite the digital advances in customer service, most people prefer human interactions, to automated solutions. Businesses still need to tackle advances in technology, but the human touch should not be forgotten when building the customer service sector.
(Oberlo)
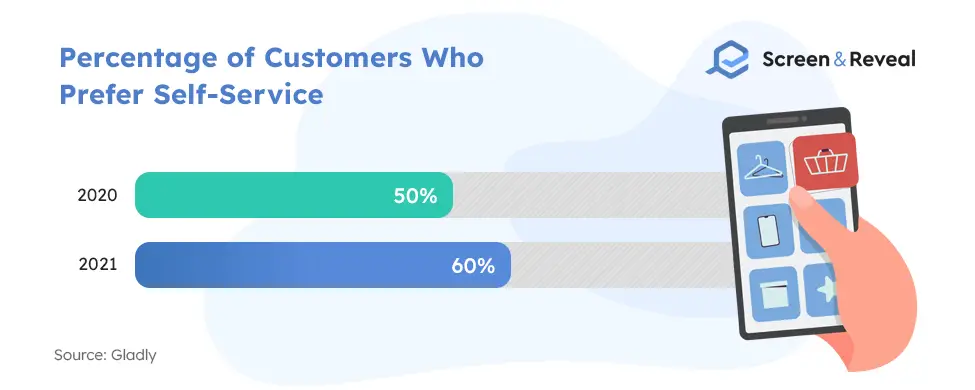
24. In 2021, 60% of consumers claimed they prefer to resolve their own issues while shopping online.
This is an increase of 10% compared to 2020, customer self-service statistics reveal. Self-service is on the constant rise since many customers who opt for shopping online prefer to solve their issues without an agent. Typically, this refers to the most common questions like shipping orders and updates.
(Gladly)
25. 20-33% of users claim that their digital services providers needed improvement or were horrible.
Customer service data indicates that about 55% of consumers are familiar with real-time order updates, while 40% know about self-service appointment scheduling. However, a significant part is not happy with the service they are receiving from digital providers.
(Airkit)
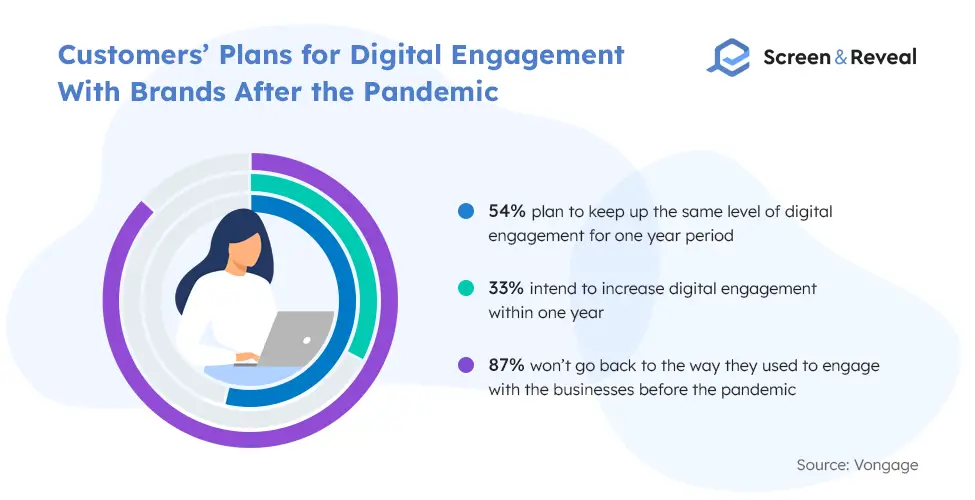
26. During the pandemic, 47% of customers increased their digital channel engagement with brands.
When asked what is going to happen after the pandemic ends, some 54% responded they plan to keep up the same level of digital engagement for one year period. 33% intend to increase it even more in the same period. Finally, 87% won’t go back to the way they used to engage with the businesses before the pandemic, stats on customer service indicate.
(Vongage)
27. With 55%, easy to get through to a human agent is the number one feature of customer service.
Other than that, 52% of consumers said that 24-hour availability is important. Another 41% think brands should have website chat with a live agent, while 40% chose multiple options for customer service communication.
(Business Wire)
28. Live chat has a 40% conversion rate.
When customers can’t find answers to their queries, the cart abandonment rates are soaring. So businesses have started implementing web chat customer service, statistics show, aiding customers to complete the purchase. This has led to increased conversion rates and a 48% increase in revenue per chat hour. Moreover, 40% of customers who use live chat have higher chances to make an online purchase.
(Freshworks)
29. 63% of customers are more likely to visit a website again if it had live chat.
Speed to lead statistics show that 44% of online customers confirmed this feature plays a huge role while they are browsing the company’s offer on the website. Moreover, it influenced 38% of customers to make a purchase.
(Freshworks)
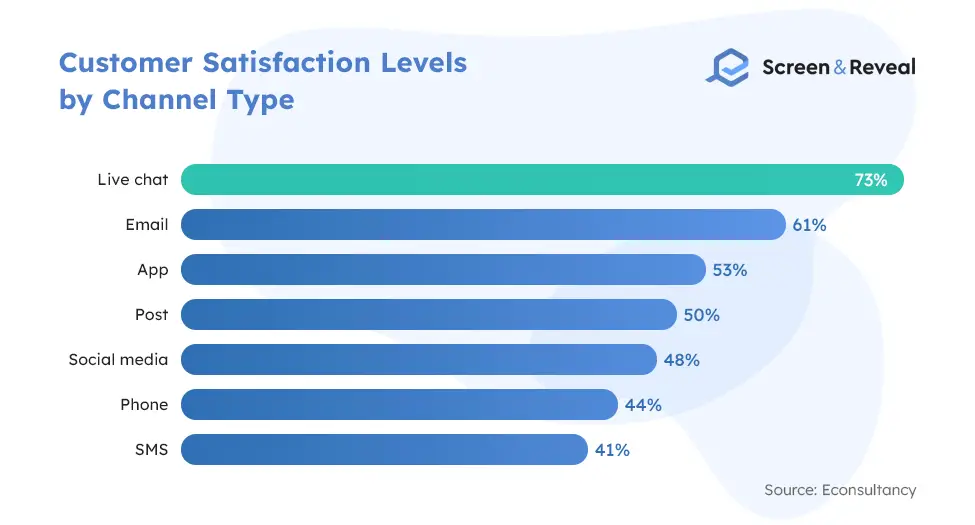
30. 73% of customers who have used live chat are happy with their experience.
Among all channels customers use to communicate with a brand, the highest satisfaction rate belongs to live chat customer service, statistics confirm. Other than that, email (61%) and apps (53%) have high satisfaction levels, followed by post (50%). Lower satisfaction rates are often associated with SMS (41%), phones (44%), and social media (48%).
(Econsultancy)
31. Chatbots could reduce costs for businesses by $8 billion by 2022.
In line with chatbot customer service statistics, this tool could be helpful in the expected surge of automated customer support initiatives. It could be particularly important for banking and healthcare, industries with a high volume of human interaction. According to predictions, between three-quarters and 90% of all inquiries in these two fields could be handled by chatbots within the next five years. In turn, this would result in cost savings of $0.70 per transaction.
(CNBC)
32. By 2025, the predictions show that AI will power 95% of customer interactions.
This includes live telephone and online chat, AI customer service statistics indicate. In fact, 78% of brands claim they have already implemented AI and VR features in their customer service departments, or in the funnel. On the other hand, only 27% of consumers worldwide say AI can deliver better service than living humans. Still, 38% believe it will improve the service, while 73% are open to companies using AI if it makes their life easier.
(The Pipeline)
33. About 17% of customers rated their AI interaction with a brand as a perfect 10 out of 10.
Customer service satisfaction regarding AI varies. Yet, some 17% gave it 10 out of 10, while over 59% of consumers rated their interactions with AI as eight out of 10. Overall, it’s a good score, indicating most customers are happy with this service.
(Zendesk)
34. 90% of retail leaders confirm that a seamless omnichannel strategy is vital.
Omnichannel customer service statistics show that 73% of customers prefer shopping through several channels, while 7% shop solely online, and 20% only in-store. Omnichannel customers, however, have a 30% higher value compared to those using one channel. They generate much more revenue.
(REVE Chat)
35. 68% of customers will spend more money with a brand that treats them as individuals, and understands their needs.
About 76% of customers expect personalized customer service, stats indicate. Companies today collect so much data, that customers want to feel valued and get personalized offers. It could be by using their preferred channel to reach them, to send them recommendations based on their history of orders, or something else. Brands need to encourage their agents in the customer service to use the data available in CRM systems to connect with customers.
(Zendesk)
Job Statistics for Customer Service Representatives
36. Teams that feel connected impact profitability to increase by 21%.
Although customers are an important half of the CX equation, another half belongs to employees in contact centers. When the staff in these units feels comfortable and connected, it’s more likely they will be motivated at work and transfer this to customer experience.
(Zendesk)
37. The number of customer service employees in the US is set to decline by 1% between 2020 and 2030.
Customer service jobs statistics for the US show that this occupation will see little or no change in the current decade. Despite this decline, every year on average, BLS projects about 361,700 new openings will pop up, on average. Most of those openings are expected to result from the need to replace workers who change occupations or retire. For reference, in 2020, there were 2,923,400 workers in this field in the US.
(BLS)
38. The median hourly wage for customer service in 2021 was $17.75.
Depending on the area and customer service, companies pay differently. For instance, this wage is somewhere around $12.67 for those in the lowest 10% and $28.19 for those in the top 10%. In the top industries, the hourly wage varies, so for wholesale trade, it was $19.76, for insurance $18.29, for professional, scientific, and technical activities it was $18.13. Finally, businesses support area customer representatives had $14.44, and those in retail trade $14.34.
(BLS)
39. About 71% of customer service agents considered leaving their jobs.
Customer service retention stats show that many employees in these departments consider quitting. Moreover, 69% of them are considering leaving the customer service field in general. 50% of customer service leaders claim that they have seen a significant increase in resignations from their departments. With this trend on the rise, 86% of customer agents demand more from companies to stay. It includes higher compensation, better management, better job positions, and more.
(Salesforce)
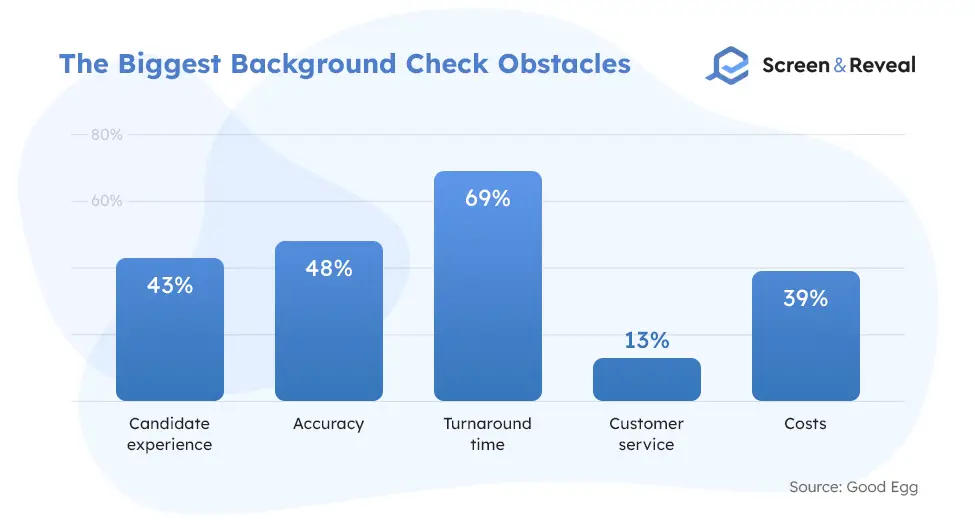
40. With 13 votes, customer service is one of the challenges for the HR screening process.
Although turnaround time is the highest challenge for background checks for employment with 69 votes, customer service is also an important factor. Quality customer service is the main part of the chain of a successful employee screening process. Other noteworthy factors include accuracy (48 votes), candidate experience (41), and costs (39).
(Good Egg)
Stats About Customer Service in Different Industries
41. 42% of insurance company customers feel like their carriers provided good support during the pandemic.
The pandemic was a test for many companies. It seems that insurance carriers passed it. Apparently, not only that they provided good support, but also, 65% of policyholders plan to continue using digital services. Two out of three of them are ready to declare and handle their claims fully online.
(Smart Tribune)
42. 85% of shoppers expect retailers to add new features to improve the digital shopping experience.
Retail customer service statistics indicate that consumers are all about the CX. Moreover, they expect virtual assistance to become more popular among retailers (72%), while the shopping experience needs to be enhanced using virtual and augmented reality (68%).
(Acquire)
43. There were 49,958 customer complaints regarding refunds registered in 2021, in the US airline industry.
Statistics from DOT reveal that the most common customer complaints included refunds. With so much potential, air travel has a lot of opportunities for improvement. Customer satisfaction plays a major part in the entire perception of the airline industry.
(Statista)
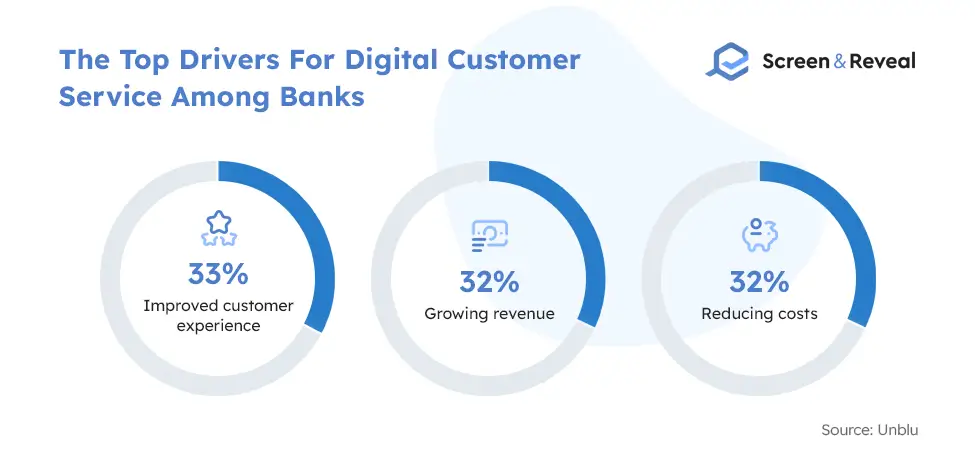
44. 85% of banking decision-makers are working on digital transformation.
Bank customer service statistics reveal that making the shift to digital customer service is of the utmost priority for banks around the world. This shift would come in a form of financial education resources, personalization tools, or mobile apps. Improved customer experience is one of the top drivers of their wish to transform the organization (33%). Following that, revenue increase is second on the list (32%), as well as reducing costs (32%).
(Unblu)
45. 15% of customers had spoken to a banking advisor using video calls before the pandemic.
The pandemic has brought a change in how customer service information is distributed. So before the pandemic, a small fraction of users had spoken to their advisors via video calls. Now, 46% of people said they would be ready to do so once bank branches open again. Some 35% would actually prefer this to in-person meetings.
(Unblu)
46. 76% of bank customers want an omnichannel experience.
Statistics on customer service when choosing a bank show that today customers consider how they can communicate with it before they opt for one. This refers to the option to choose between in-person and remote access to their advisors. In fact, 59% of customers expect on-demand, anytime customer service.
(Unblu)
47. Today, 47% of bank customers would open a new account online.
Before, consumers would prefer to open new accounts directly at the bank. Now, nearly half would gladly do it via their desktop, while 37% would do it using a mobile app or web. About 47% opted for the face-to-face option, statistics on banking customer service suggest.
(Unblu)
48. Solely 49% of patients say that healthcare customer service is satisfactory.
It seems that patients were mostly overlooked when the US healthcare system was built and organized. In fact, it seems to revolve more around providers, government, drug companies, and insurers. This frustrates consumers, and over half of them aren’t happy with the customer service they are receiving, medical customer service statistics reveal. This underscores the need for using healthcare background check services before hiring employees in such a sensitive industry.
(Coveo)
49. 70% of patients think of quality customer service as the most important factor for rating a healthcare provider.
Patients want their health insurers to offer experience as any bank or telco does. Robust portals for members, chatbots, and automated services are just some things on the list. To reap the benefits of improved customer service in health insurance, stats show you need to work for your users.
(Coveo)
50. Restaurants that develop an emotional connection with customers receive 25% more value.
Emotional connection creates added value through different means. For instance, 60% of guests with a positive experience dine there more often. Moreover, 39% claim it would push them to spend more, while 41% would recommend the restaurant further to their family and friends. That said, 73% of guests with a bad experience would also share this with others, food service customer service statistics indicate.
(Lunchbox)
51. A one-star increase in restaurant Yelp reviews results in a 5-9% revenue growth.
Yelp and other platform reviews increase the chances of a restaurant increasing its revenues. About 25% more people check the reviews on sites like Yelp, TripAdvisor, or OpenTable, than actual food critics’ reviews. Some 60 percent read reviews before going out for a meal.
(Benbria)
Outsourcing Customer Service Statistics
52. The outsourcing customer experience market is set to hit $82 billion before 2023.
Overall customer experience market is set to grow at a 3.51% CAGR through 2023. In 2019, the market was estimated to be worth $75.1 billion. Outsourced customer experience and customer service industries are growing mostly due to corporations trying to reduce costs and improve consumer satisfaction through the use of professional companies.
(Apollo Technical)
53. The Philippines has a 20% of the global call center market share.
The Philippines has emerged as a leader in call center outsourcing by overtaking India. Currently, it’s the largest business process outsourcing destination in the world. Approximately 60% of all US companies using BPO services, do it with a Philippine-based contact center.
(Finances Online)
The Bottom Line
These customer service statistics serve to help you navigate through the changing ecosystem of customer interaction with a brand. With the help of the knowledge you gain, you can adapt your own strategy and implement the best customer experience. Moreover, you now know that customers interact through many channels, so the companies need to adopt an omnichannel approach. Similarly, brands have to put into use new technologies to cope with the growing needs of their consumers.
Sources: Oberlo, Zendesk, Locus, Business Wire, Airkit, Bloomfire, Statista, Gladly, Bain&Company, Zendesk, Vongage, Freshworks, Econsultancy, CNBC, The Pipeline, REVE Chat, BLS, BLS, Salesforce, Good Egg, Smart Tribune, Acquire, Statista, Unblu, Coveo, Lunchbox, Benbria, Apollo Technical, Finances Online